UX Research, Journey Mapping, Service Design
Adaptive: Mapping the Lab Technician Journey Behind High Turnover
A qualitative research study with every laboratory technician in specimen intake, synthesized into a detailed user journey map that showed leadership, step by step, why skilled people were leaving a high-value cancer diagnostics lab.
 Adaptive Biotechnologies
- 01 Problem
Laboratory technician turnover was high, and leadership couldn't see why. The pain lived inside a long, multi-team intake workflow that no single person saw end to end.
- 02 Approach
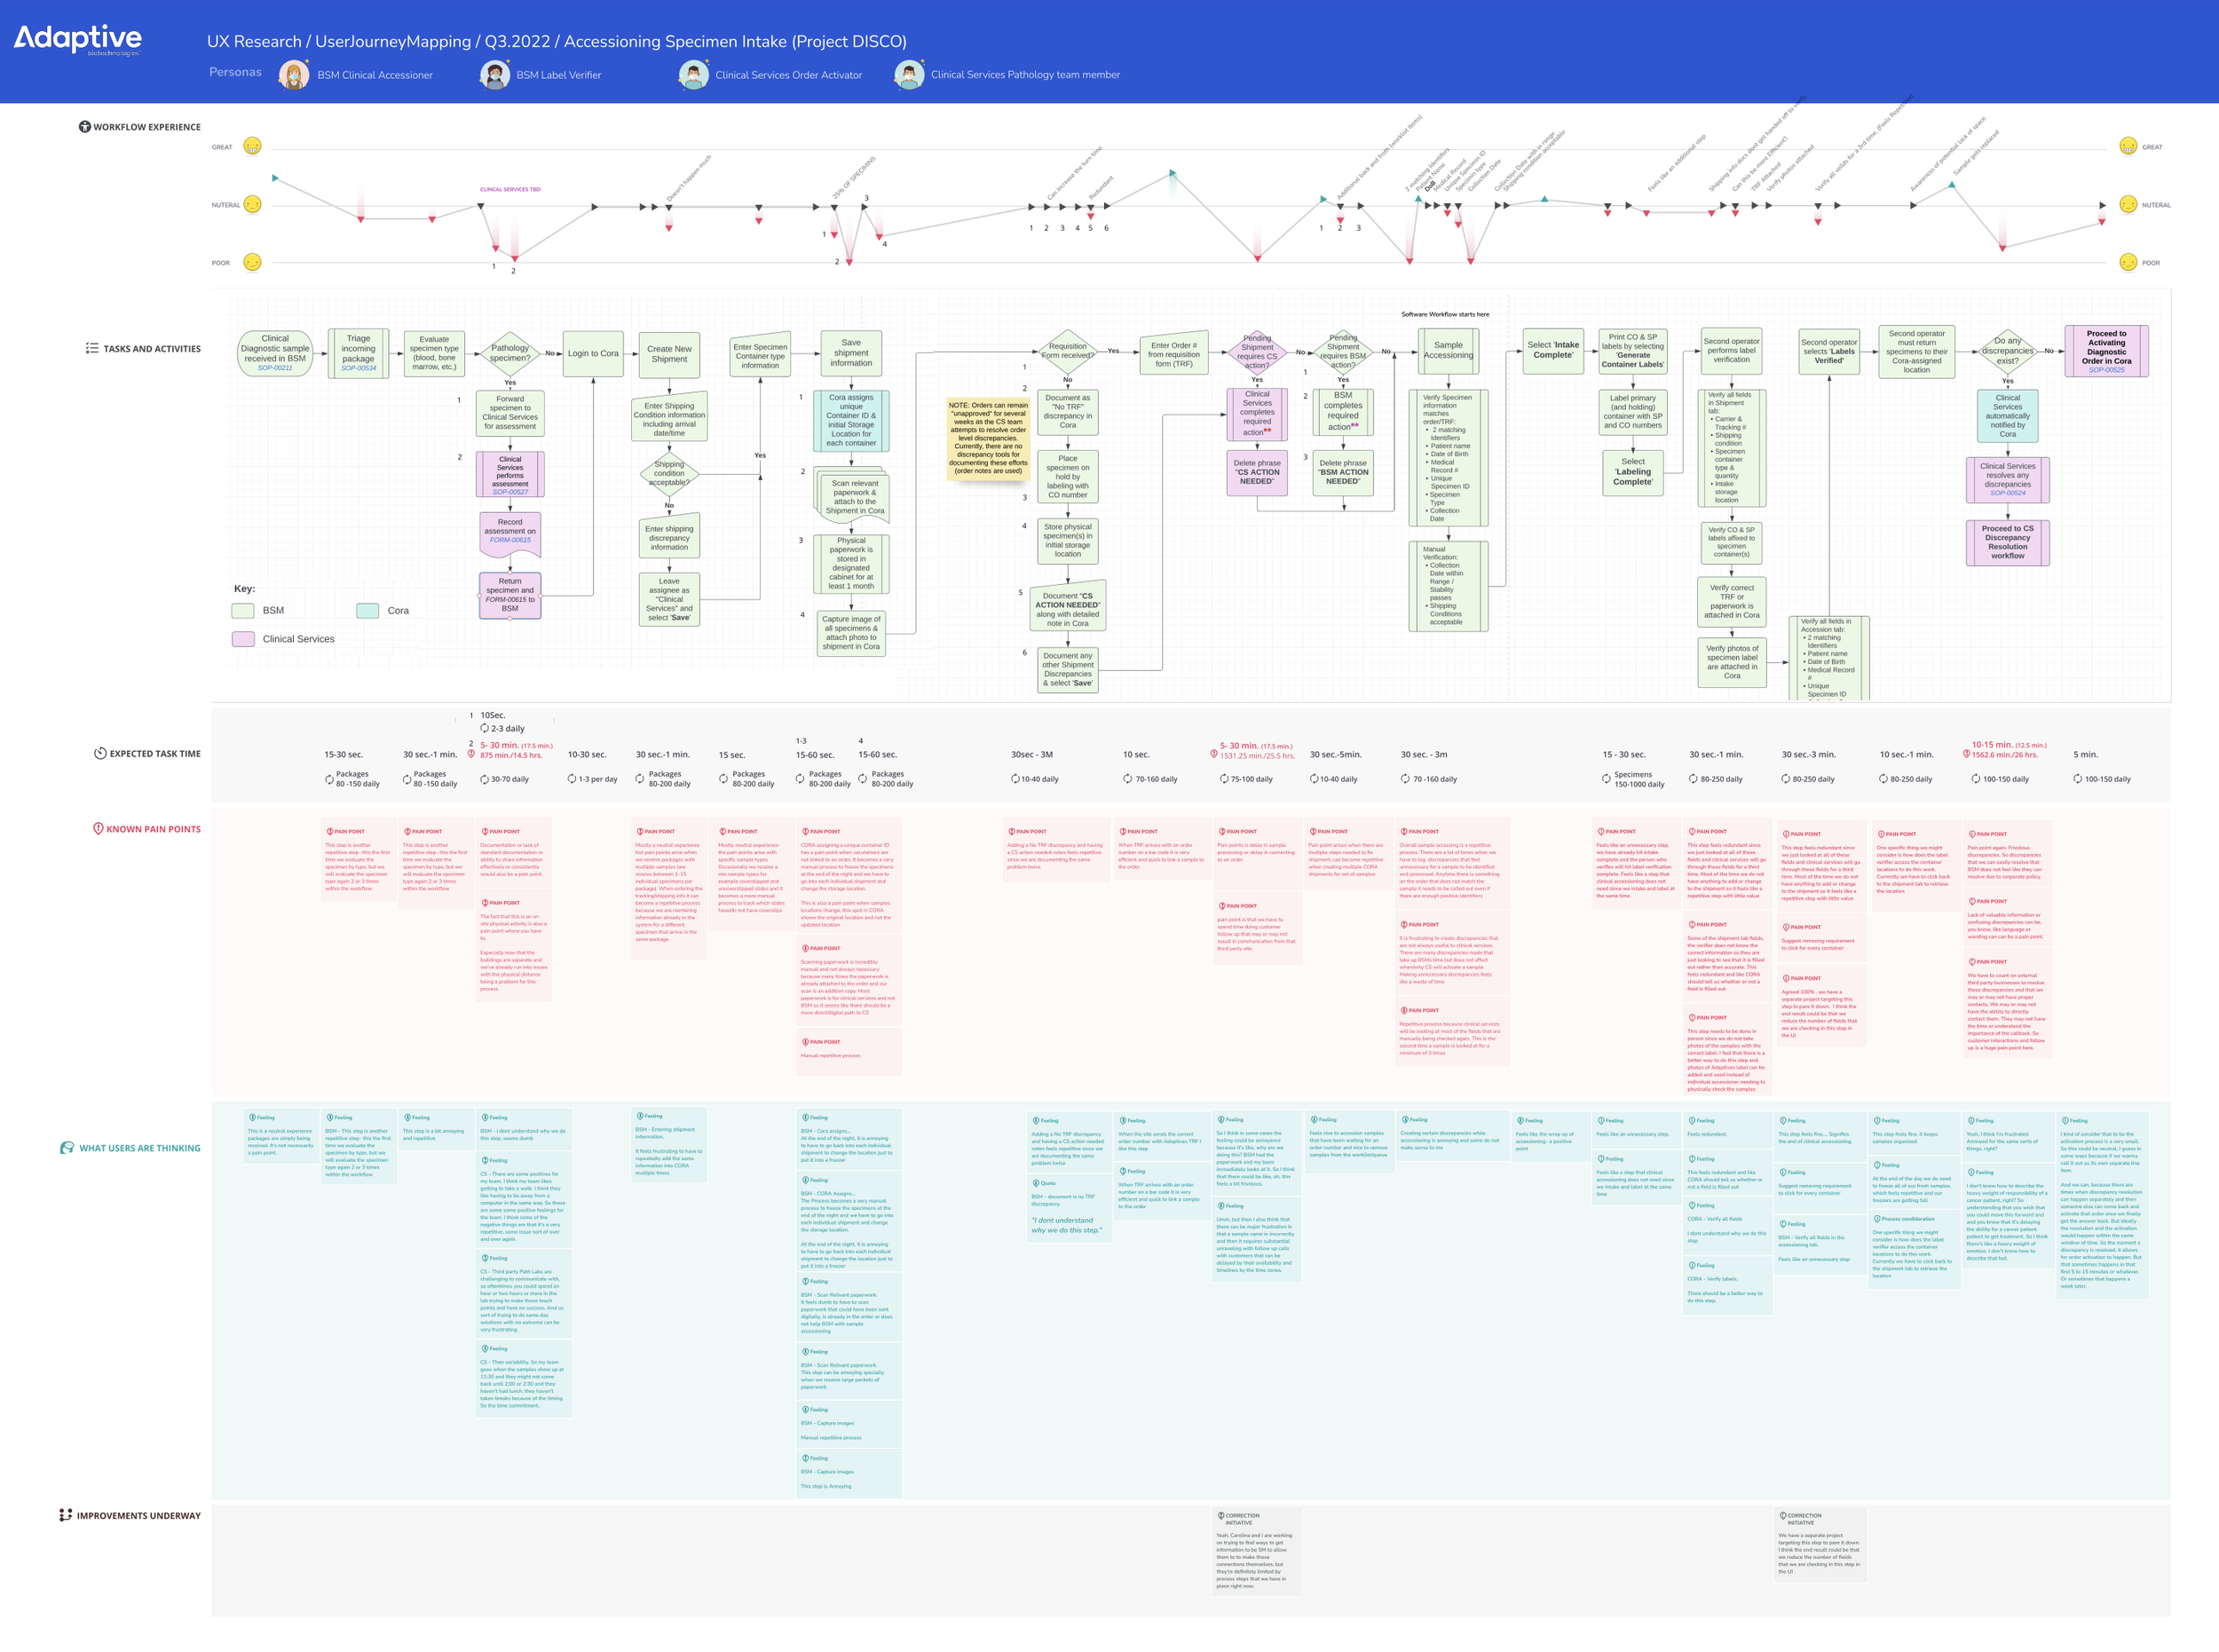
Interviews with all technicians across four roles, synthesized into a journey map that layers each role's emotional experience over tasks, expected task times, pain points, technicians' own words and improvements already underway.
- 03 Outcome
The map surfaced findings that shocked leadership, from samples reviewed at least three times to teams skipping lunch to keep up, and gave stakeholders a shared, inspectable picture to act on.
Project summary
Adaptive Biotechnologies runs a high-value cancer diagnostics laboratory in Seattle, and every test begins with specimen intake: receiving packages, accessioning samples, verifying labels and activating orders. In 2022, the lab had a problem leadership could see but not explain. Skilled laboratory technicians kept leaving.
I led a qualitative research study, called Project DISCO internally, to find out why. The goal was to discover every pain point in the technicians' software, workflows and day-to-day work, and to turn those findings into something stakeholders could explore for themselves. That something became a detailed user journey map.
This case study complements my product work at Adaptive, Modernizing Order Management for a Biotech Leader.
The research
Every technician in the intake workflow was interviewed, across four roles:
- BSM Clinical Accessioner, who receives and accessions incoming specimens
- BSM Label Verifier, who confirms samples are correctly labeled
- Clinical Services Order Activator, who connects samples to orders and activates them
- Clinical Services Pathology team member, who works with outside pathology labs
Interviews covered each step of the work: what people do, how long it takes, what goes wrong, and how it feels. Because intake crosses teams, the research had to follow a single sample through all four roles, not just study one desk.
Designing the journey map for stakeholders
The map is the deliverable, so I designed it for the people who would act on it: leadership and stakeholders who had never worked the intake bench. It reads top to bottom in layers, all aligned to the same steps of the workflow:
- Workflow experience. An emotional line for each role, rising and falling across the journey, so the low points are visible at a glance.
- Tasks and activities. The full process flow with decision points, color-coded by team.
- Expected task time. How long each step takes, including the steps repeated per specimen.
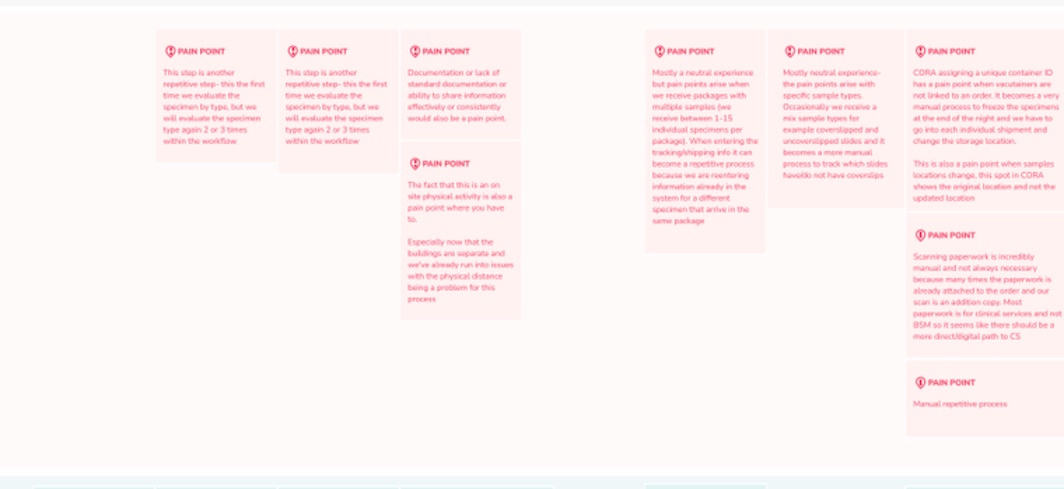
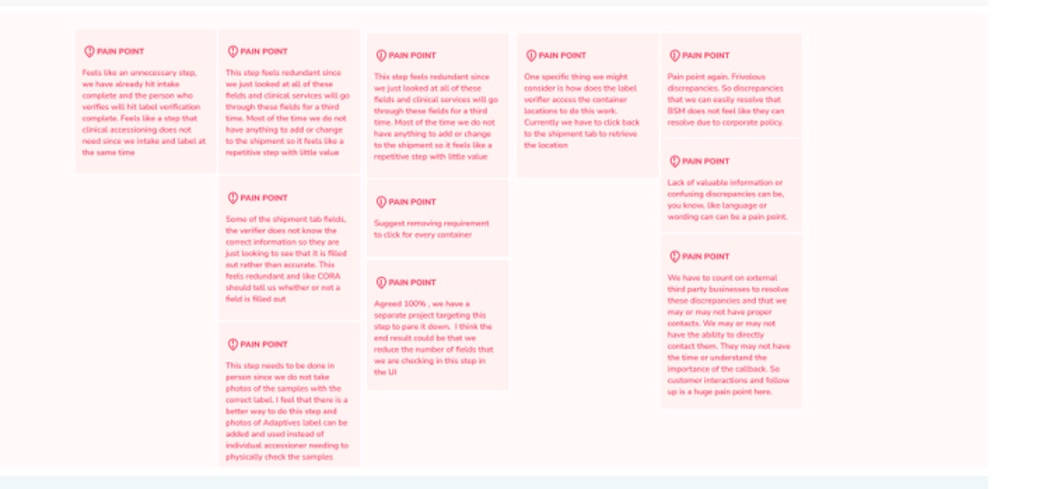
- Known pain points. Every problem technicians raised, placed exactly where it happens.
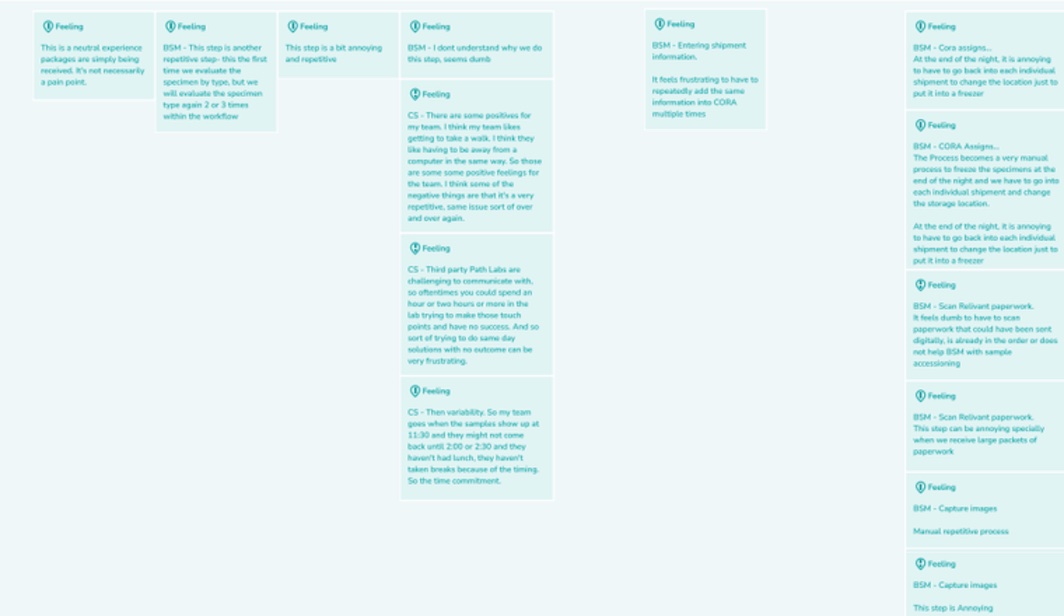
- What users are thinking. Technicians' own words, kept close to verbatim, so stakeholders hear the people, not a summary of them.
- Improvements underway. Changes already in progress, so the map doubles as a plan.
That structure lets a stakeholder start anywhere, from a pain point, a role or a step, and trace it through the whole system.
What we found
The findings were shocking to leadership, because they showed how much of a skilled technician's day was spent on work that didn't need to happen.
- The same sample, checked again and again. Specimens were evaluated by type two or three times within one workflow. Clinical services re-checked fields that had already been checked, so a single sample was reviewed at least three times. As one technician put it, the step "feels redundant since we just looked at all of these fields."
- Discrepancies nobody needed. Technicians logged discrepancies that didn't change whether a sample was activated, documented the same problem twice, and raised "frivolous discrepancies" they couldn't resolve because of corporate policy. "Making unnecessary discrepancies feels like a waste of time."
- Manual work the system should do. At the end of each night, technicians went back into every individual shipment to change its storage location before freezing. They scanned paperwork that was already attached digitally, re-entered the same information for every specimen in a package of up to 15, and checked labels in person because no photos were captured.
- Chasing outside labs. The pathology team could spend "an hour or two hours or more" trying to reach third-party labs, often with no result, for same-day problems they couldn't solve alone.
- The human cost. When samples arrived around 11:30, a team might not get back until 2:00 or 2:30, without lunch or breaks. Split buildings added walking and delays.
Not everything was negative. Some technicians valued time away from the computer, and several steps were neutral. Showing that balance made the hard findings more credible to leadership.
The outcome
The journey map gave leadership what interviews alone couldn't: a shared, inspectable picture of the intake workflow, with turnover's causes placed exactly where they happen. Instead of debating whether the work was hard, stakeholders could point to the step, the time it took and the technician's own words. Work to cut redundant fields and checks was already being scoped, and the map became the reference for prioritizing what to fix next.
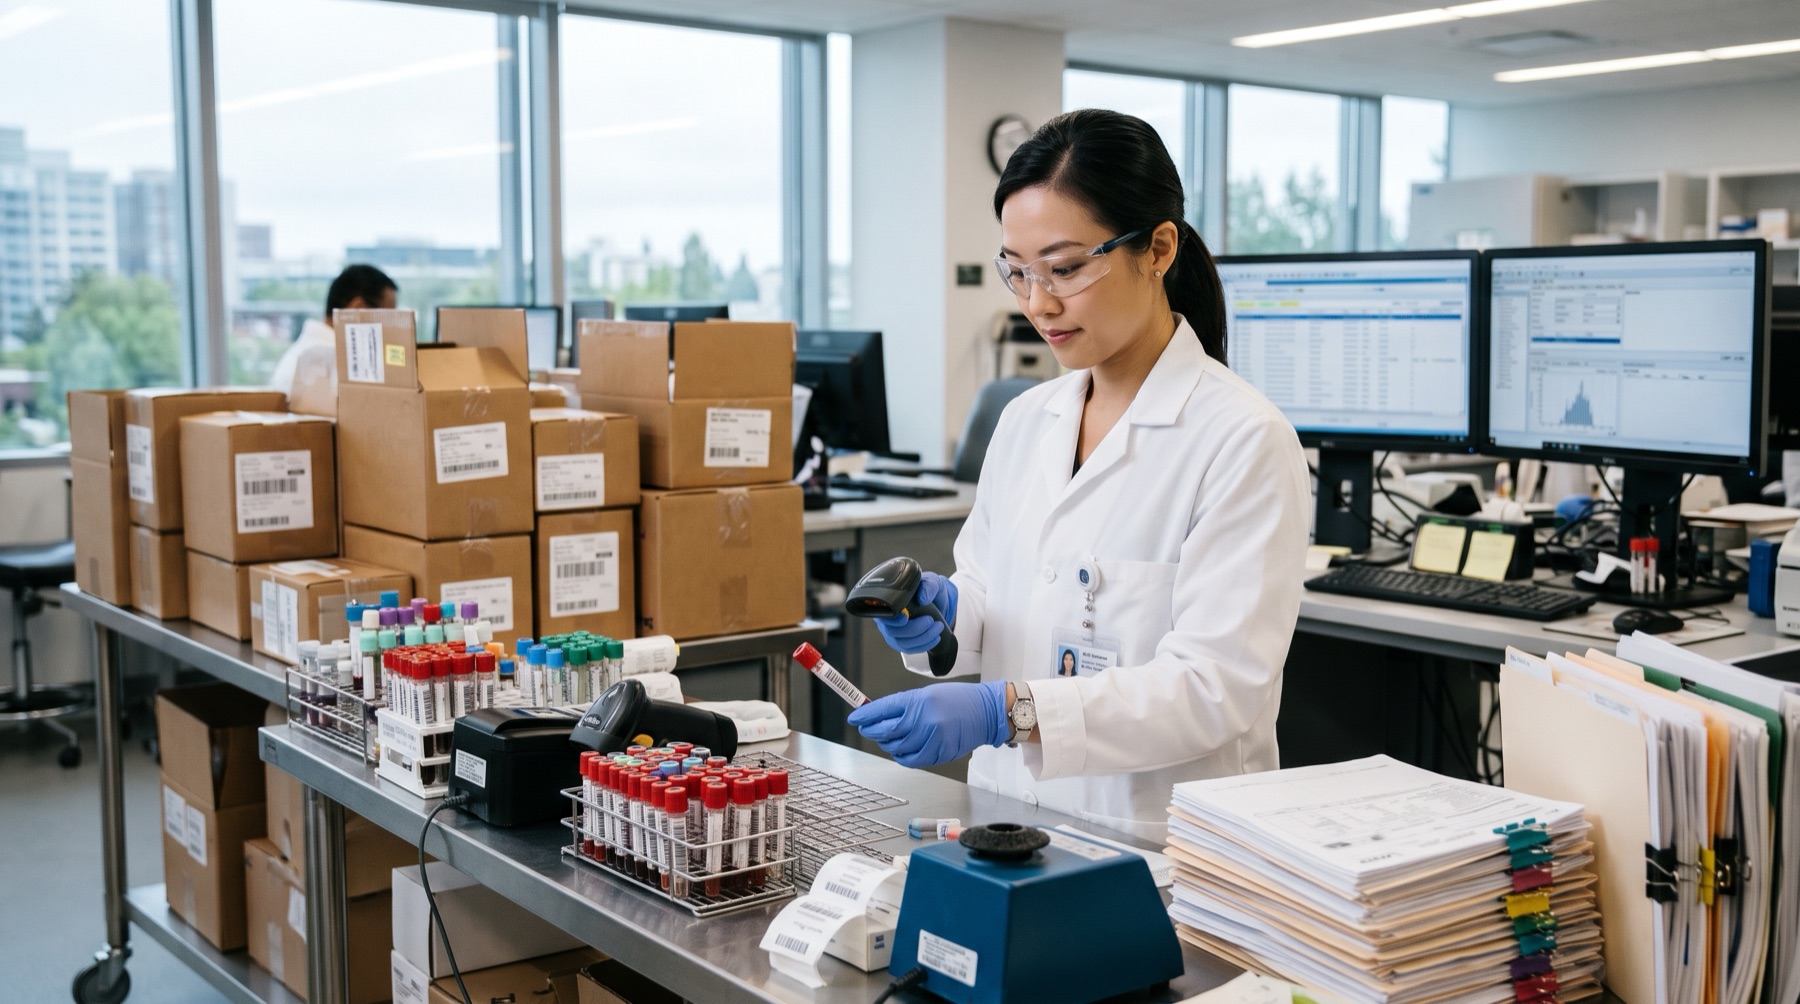
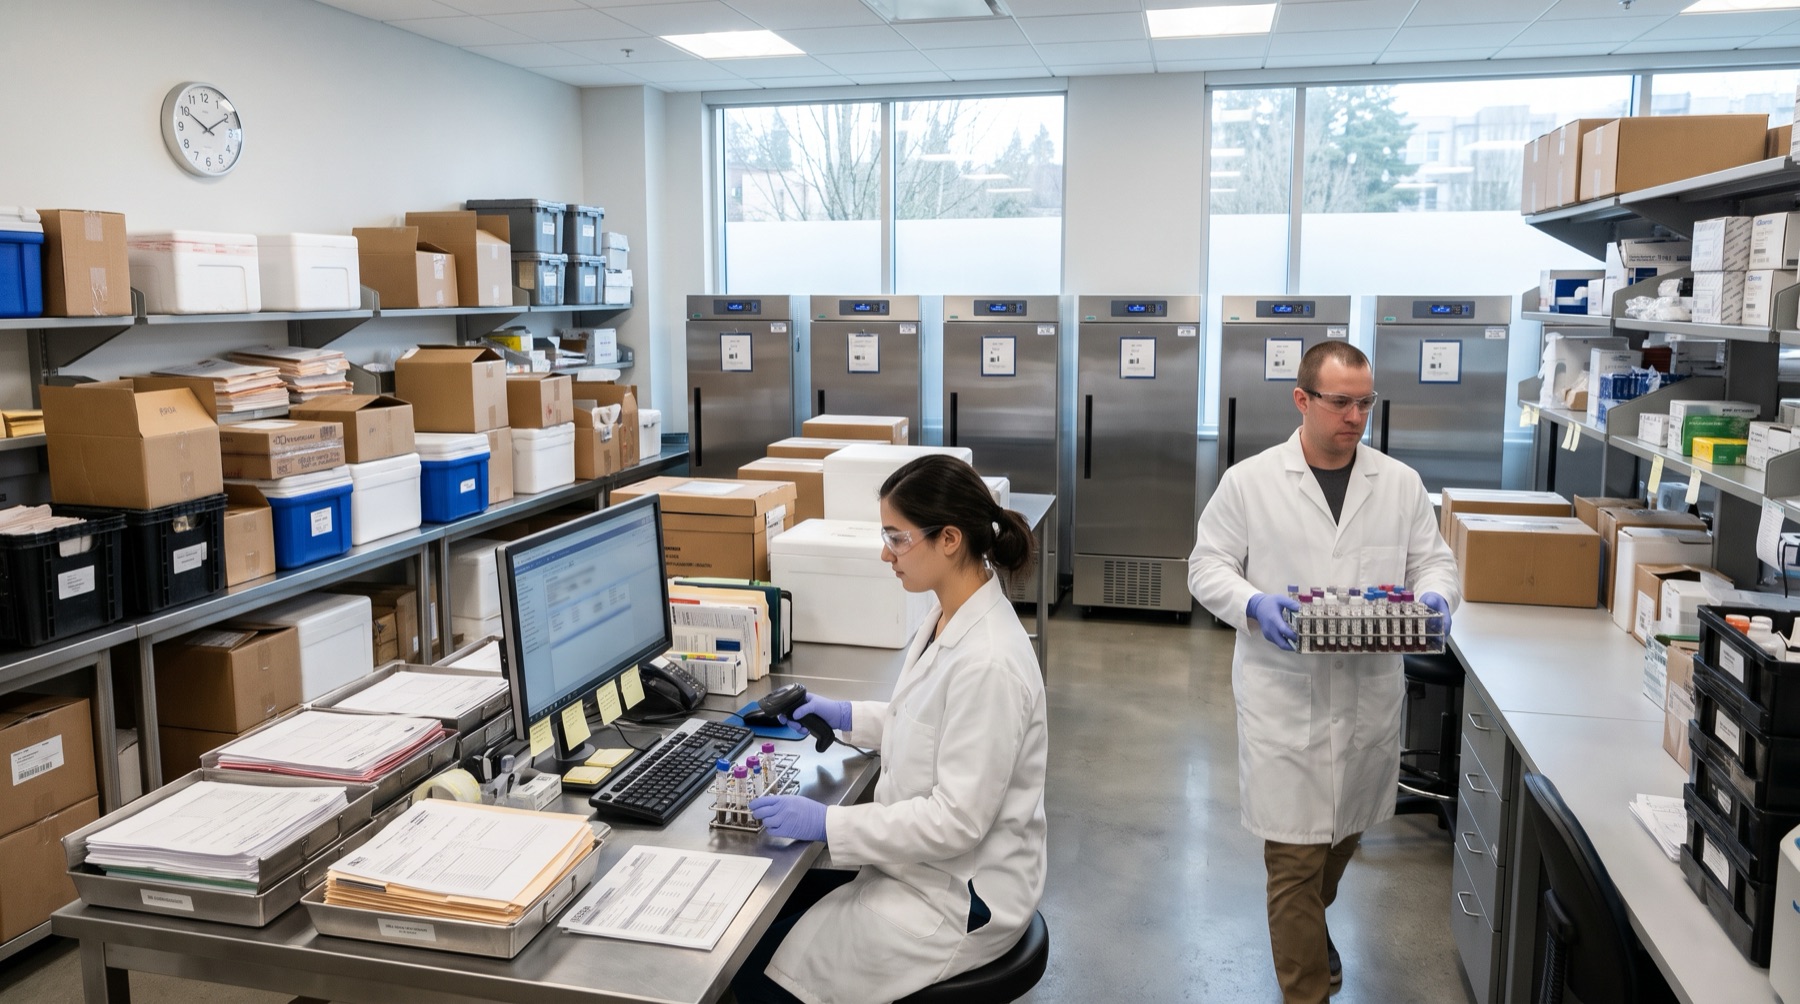
The two lab images on this page are AI-generated illustrations, not photographs of Adaptive's laboratory. The journey map and its close-ups are the original research artifact. Open the map full screen to zoom in.
Skills: UX Research, Qualitative Interviewing, Journey Mapping, Service Design, Research Synthesis, Stakeholder Communication.