


PROBLEM
The existing OMS and LIMS were inefficient, causing bottlenecks in the tracking of specimens and management of patient data. Analysts faced a high cognitive load due to non-intuitive workflows and limited data insights, hindering decision-making and operational efficiency. The need for a unified, responsive interface with advanced analytics was clear to support the company’s rapid growth.
INTRODUCTION
Adaptive Biotechnologies required an overhaul of its Order Management System (OMS) and Laboratory Information Management System (LIMS) to streamline the processing and tracking of patient samples. The goal was to modernize their systems while integrating IBM’s Carbon Design System, ensuring that data flow and user interactions were intuitive and scalable.
The new Order Management System (OMS) coupled with the new Laboratory Information Management System (LIMS) support both Clinical Diagnostic patient orders and Clinical Trials orders. This interoperability has significantly enhanced the system's efficiency and responsiveness.
By implementing a new software solution, Adaptive sought to streamline operations, enhance user experience, and modify SOPs to better support its expanding customer base while keeping its commitment to excellent patient care. The UX team was asked to focus on reimaging and enhancing the Order Management System (OMS).
BACKGROUND
-
The formation of a "Tiger Team" allowed for agile, organic progress outside the typical sprint cycles, ensuring a swift and effective integration of UX solutions and expediting the MVP Launch.
-
A Systems Architect joined the team, marking the commencement of the product's reconstruction. The initial phase aimed to develop a modern microservices architecture that would not only enhance the order management capabilities but also improve the data systems, existing APIs, and laboratory software used by the molecular biology team. Subsequent phases planned to expand this modernization to include the research and computational biology teams as separate ecosystems.
-
The UX team led a front-end modernization project, aligning developers with modern agile practices and collaborating with a front-end contracting team to develop a unified interface across all systems. The selection of IBM’s Carbon design system was pivotal, chosen for its robust data visualization capabilities and its compatibility with open-source data tables, streamlining integration into Adaptive's ecosystem. This approach focused on rapid development with a limited scope of components, drastically reducing the development timeline from eight years to just one.

THE METHODS
STRATEGY
DUEL TRACK DEVELOPMENT: In the early stages of the project, the team was asked to replicate the existing pages from our enterprise software CORA. The thinking behind this was simple: We still needed to facilitate orders in 99% of how they've been done historically. (Old System shown to the right)
PAGE-BASED WORKFLOW IMPROVEMENTS: As the project continued, it was agreed that the business's requested improvement would be considered considering design improvements to the individual pages of our existing workflows.
EARLY ETHNOGRAPHIC RESEARCH: Our qualitative investigation at the subject matter expert level and observational level from observations of team members utilizing the software platform produces the following findings to focus on as we make design improvements.
OPENSOURCE DATA TABLE ADOPTION: It was agreed that the existing front-end experience and data table library needed a facelift. After the UX team examined viable options, an audit was performed, and a new design system was chosen.

Image: Original system with several component libraries and no “official“ design system.
A NEW DESIGN PROCESS
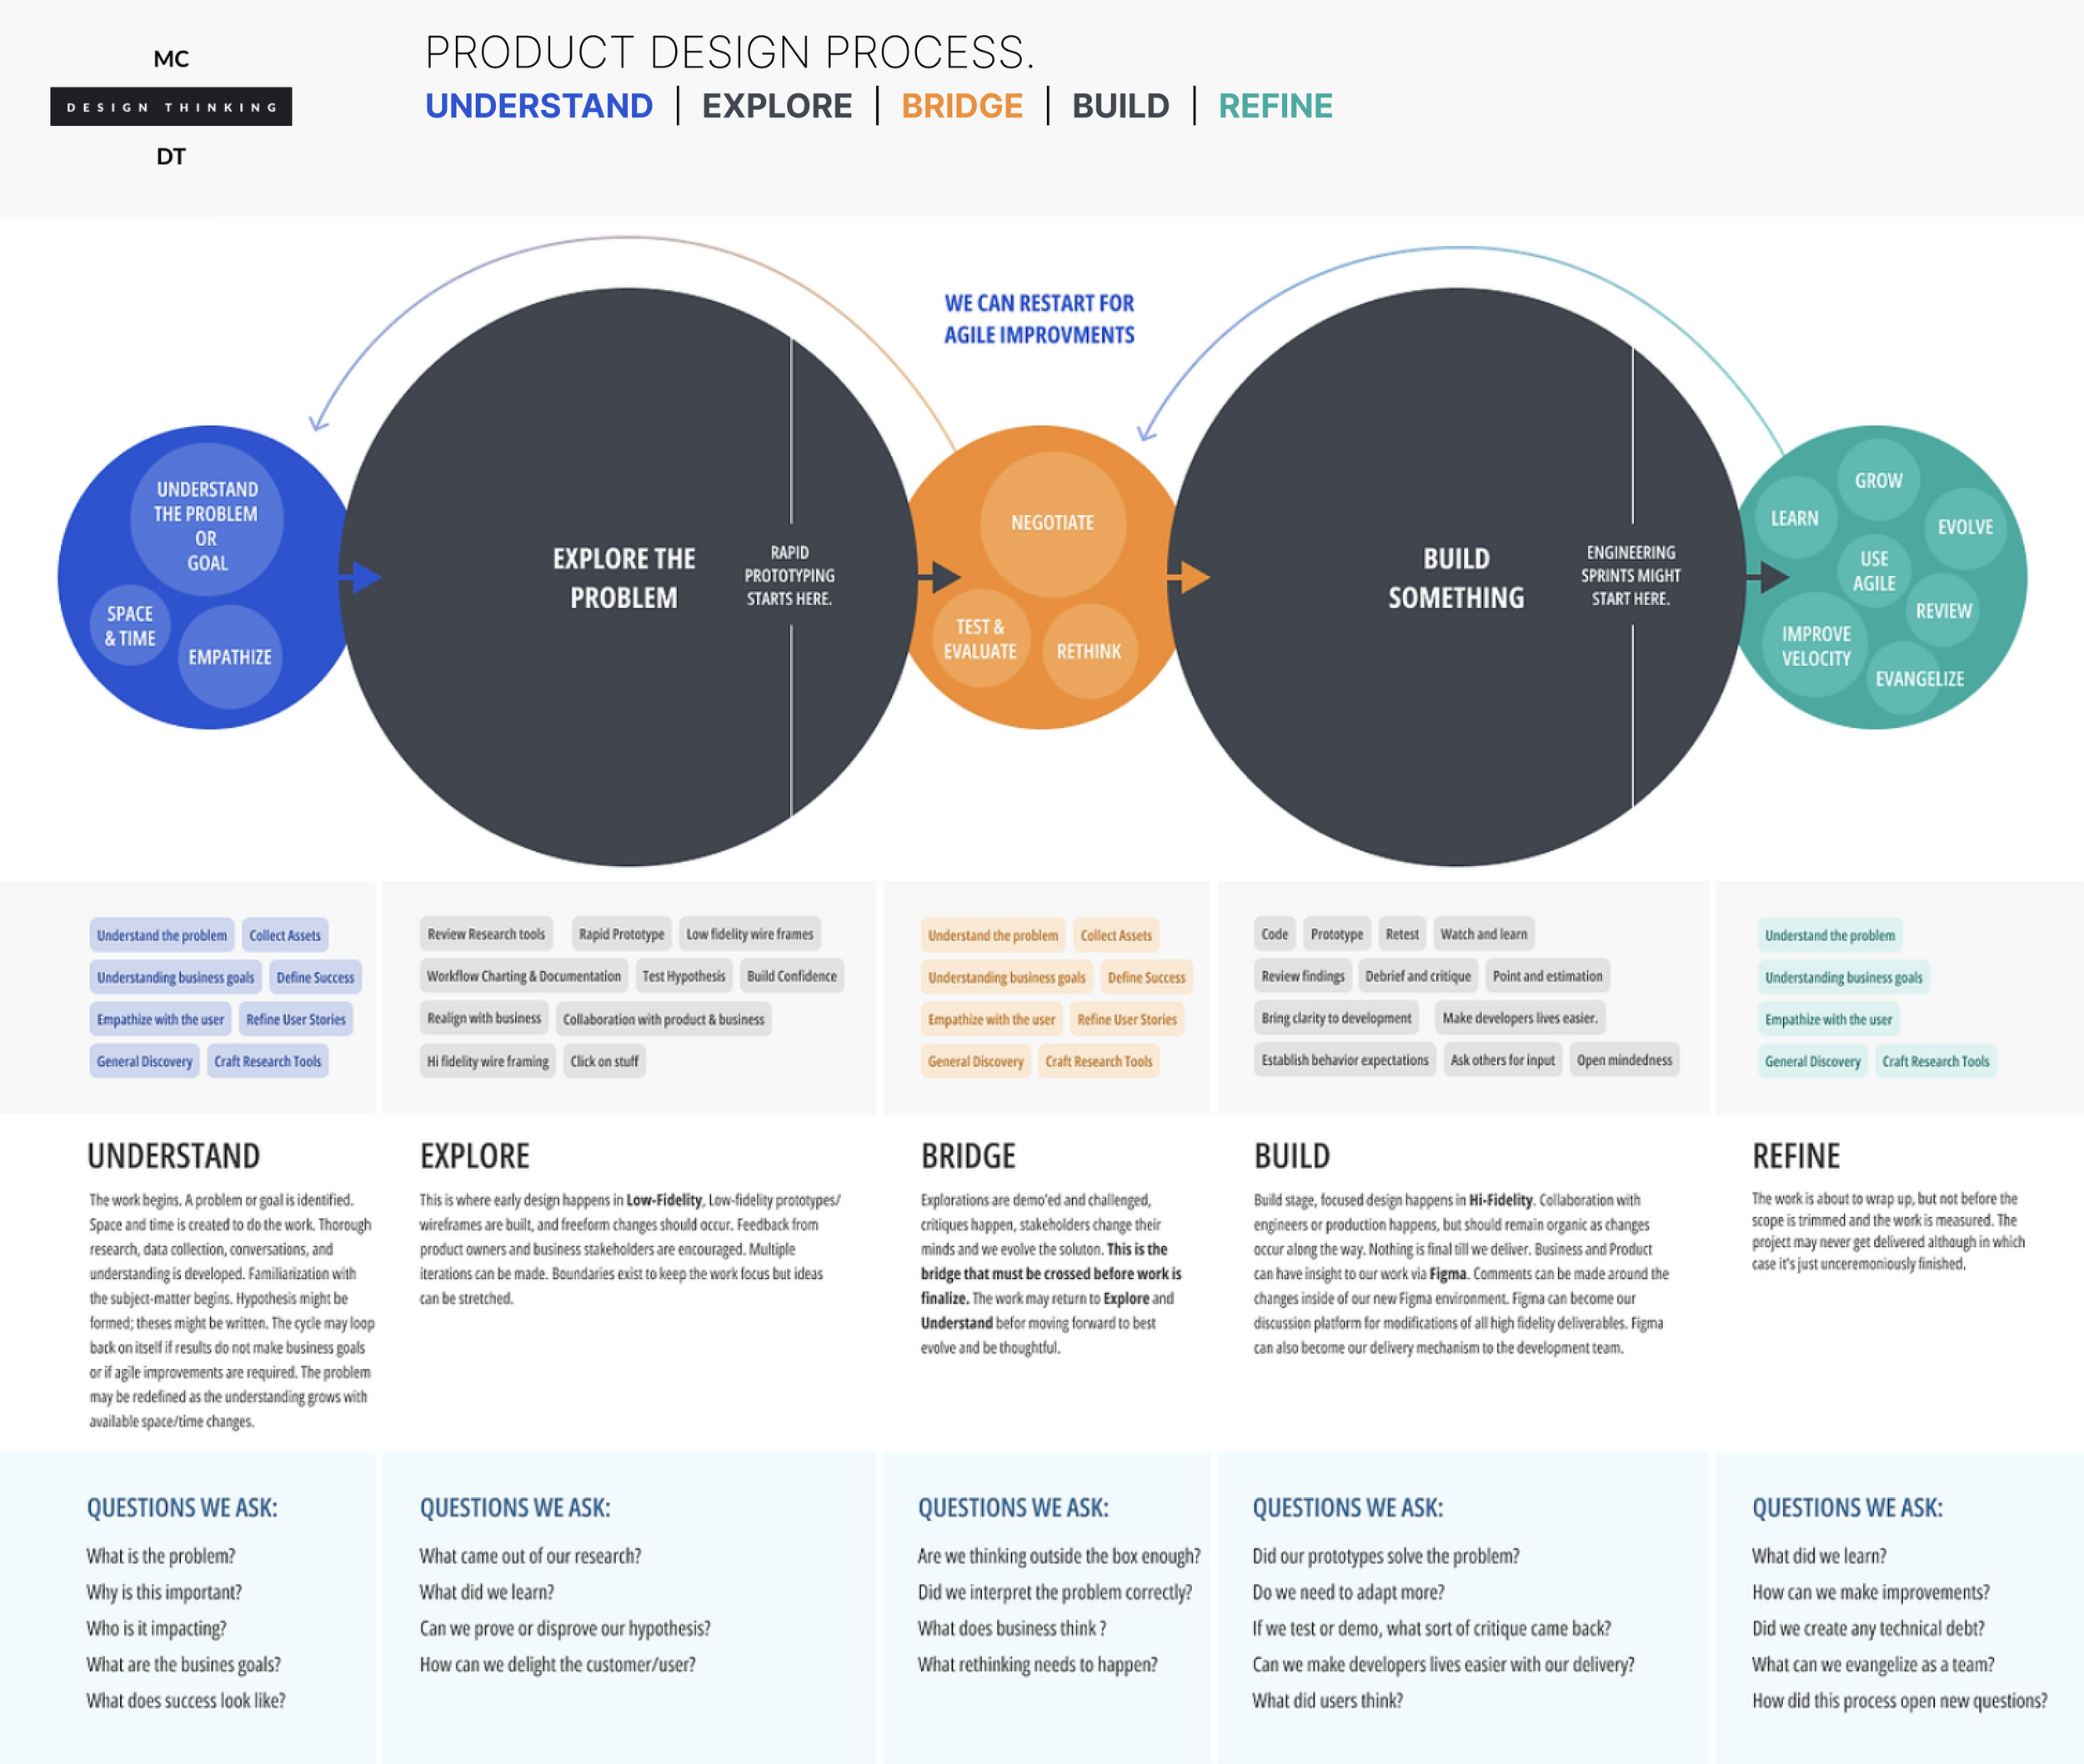
In an effort to establish a high degree of coverage across the new platform and its many stakeholders. The process addressed both Design and Research, which was new for the company, and offered a bridge to building software in a traditional sense.
A New Design System.
DESIGN EVANGELISATION:
Our month-long audit guided us to the philosophy and scalability of the Carbon Design system:
We pulled guidance for our designs from Carbon’s sophisticated documentation and case studies library.
We became familiar with the thoughtful guidelines around the 2x Grid, Navigation, Open-Source Data Table Lib., functions, Search patterns, componentry, and more.

We set the stage for what "Could Be" via evangelization across the company.
The adoption of the carbon design system would:
1. Serve all 8+ software platforms.
2. Reduce UX design time via pattern sharing.
3. Increase front-end developer sprint time efficiencies via component familiarity.


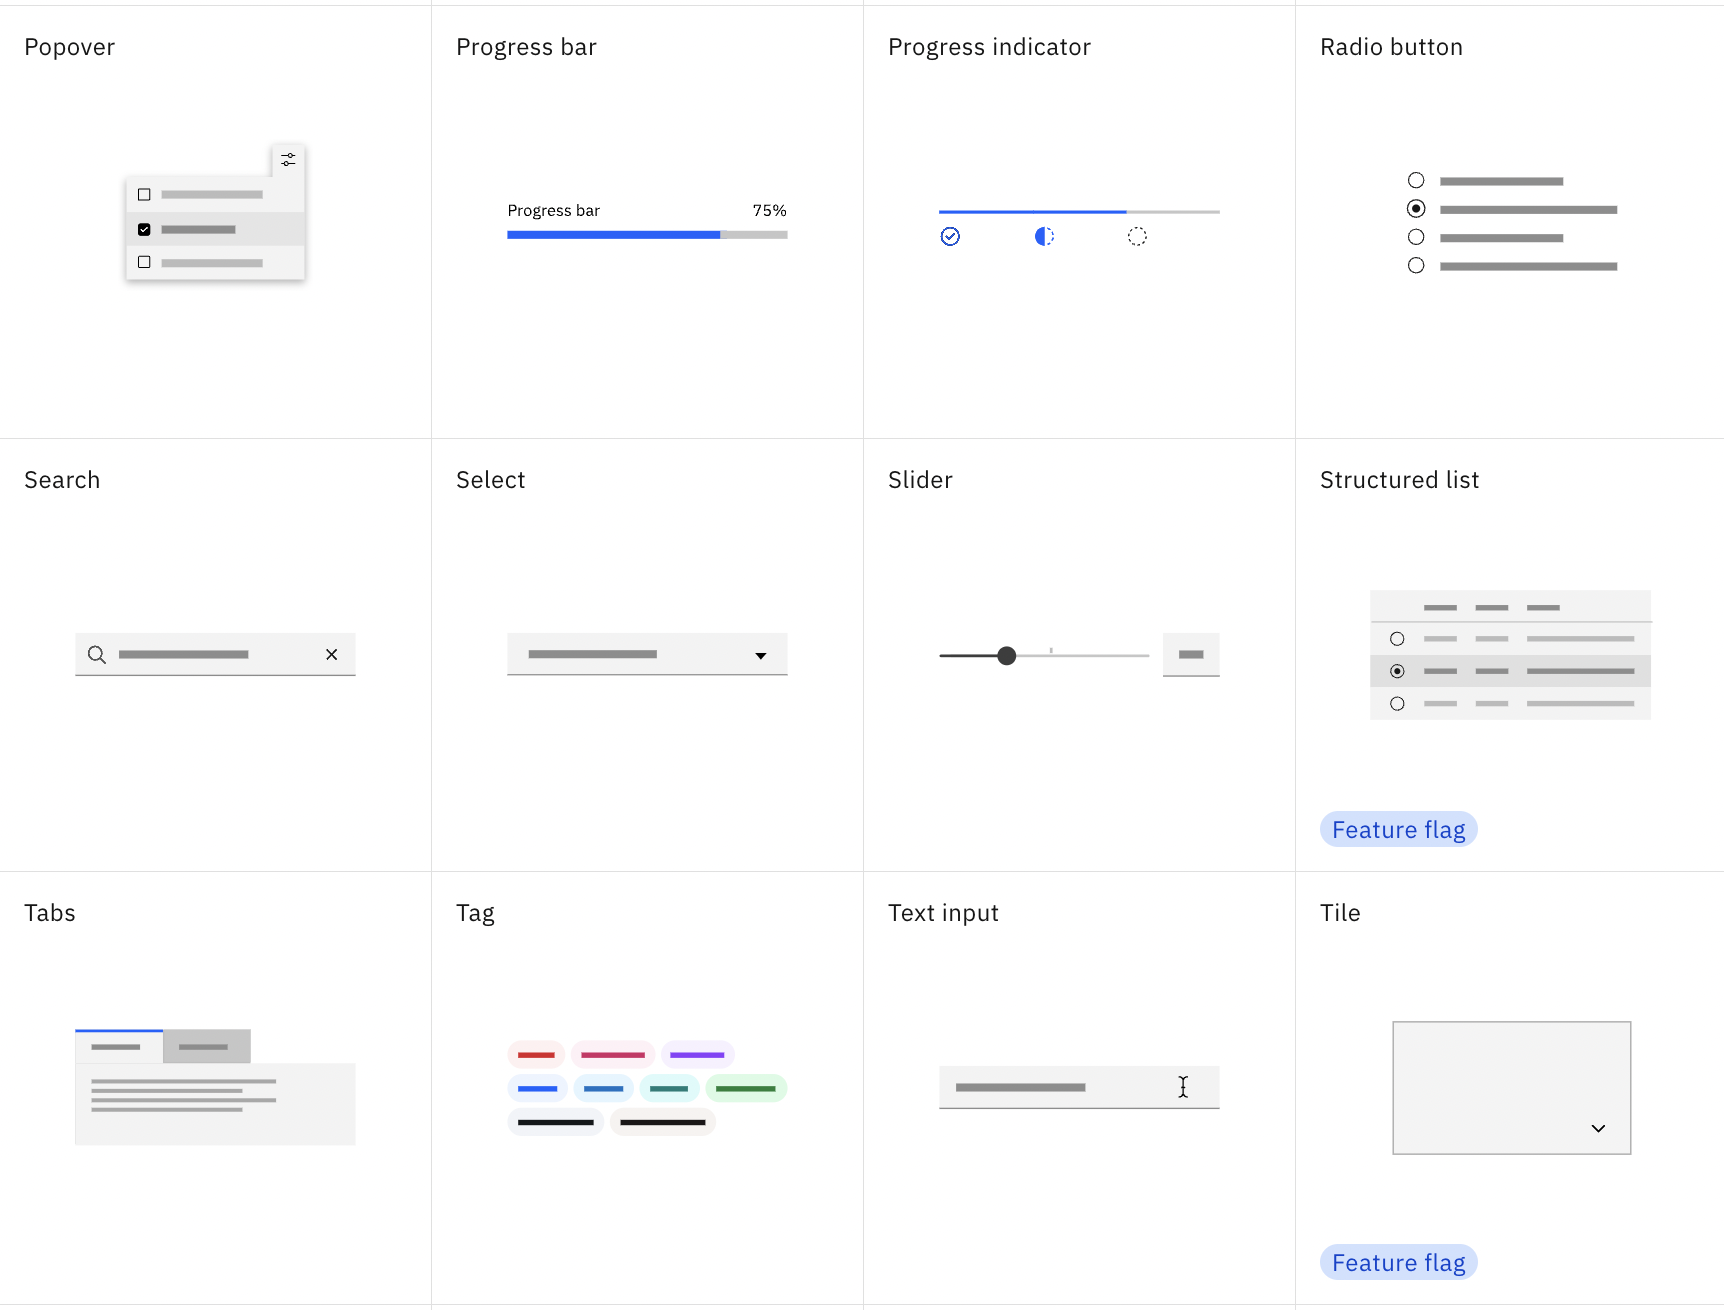


Mood boards and evangelization sessions with38+ subject-matter experts (SMEs) cemented the choice for a data-driven enterprise system backed by IBM.

Inspired by the work of the design team at IBM.
The award-winning team at IBM's Carbon Group has published a multitude of flows for a wide range of use cases. We collected those flows and made a mood board for our stakeholders.
Research Findings
From our research, the UX team discovered the need for the following themes of user experience enhancement:
Quick Summary of UX Findings:
Cognitive load Reduction
Management of daily work
Simplification of navigation
Re-focusing patient architecture, lists, linking
Streamlining specimen and shipment workflows
Dashboarding analytics
-
Our persona interviews surfaced an important commonality: the users’ jobs were incredibly detailed and “in-the-weeds.” The interfaces of the old system were cluttered with numerous fields and excessive information, overwhelming users. Each time challenged their need to see all of those fields, they reiterated that the inclusion of all fields was necessary. We would need to find a way to reduce cognitive load without removing content.
-
Our research surfaced challenges around managing daily work:
Delegating work was not always cut-and-dry. Some of the teams interacting with the system were fairly large, and most often, multiple eyes were required on the same order, specimen, or patient. Resolution of issues required for phone calls, emails, notes, and cross-system usage. Users always needed multiple tabs open, to reference other systems.
Many of the issues needing resolution were complex in nature and often required multiple users with their own knowledge and background information.
Much of the time spent by users was focused on painstakingly tracking down orders or patients, like a bad treasure hunt. For example, users would be forced to use the slow and clunky filtering capabilities on the old system to open multiple tabs to see if they offered the right set of characteristics for the user to accomplish their tasks.
The highlight use-case for the order management system was that users needed to manage their daily work by looking for active orders that had similarly related problems. This approach helped them cognitively address the same “chunk” of problems within a period of time.
-
Navigation offered by the old system was intuitive, as though an afterthought.
Our UX team was able to learn a lot and seek guidance from Carbon’s thoughtful navigation guidelines. We later brought this thinking into a few simple, yet promising navigational improvements.
Re-focusing patient architecture, lists, linking
Adaptive aims to be a patient advocacy organization. There is immense business value in orienting the user experience around any opportunity to clarify patient information.
We discovered the following pain points for users viewing patient data:
Patient Details pages lacked real-time information about Orders and Specimens.
We discovered that this information lived at the heart of inquiries by our customers (Clinicians offering clinical care for the patients.) Ie. users had to search for a list of orders relevant to a patient open all those orders in separate tabs, and then cognitively distill an overview of the most recent issues, orders, and statuses.
Patients often showed up as duplicates in the system.
Due to easily made human errors of birthdate or name-change discrepancies, one patient might end up in a fragmented display of duplicate records. These were high-priority issues that our analysts had to address.
Information architecture was oriented around Orders, not Patients.
If a physician called in curious about the status of clinical care for one of their patients, there was no quick view in the old system to provide that information.
Clinical trials offering de-identified information had no way of linking to Patient information that was already in the system. This implication on the patient's end was painful: they would have to take multiple blood or bone marrow samples to provide the same information, over and over again. Knowing that the information was in the system but simply lacking the wiring to connect – this highlighted a high-priority concern.
-
Historically, the molecular biology laboratory at Adaptive, which handles specimens and samples for clinical diagnostics (Dx) and clinical trials research, has used varied terminology and labels across its systems. The data transfer between these systems is nuanced and complex. To streamline this, a significant reorganization effort was undertaken to simplify system labeling and clarify the parent-child relationships among specimens, samples, shipments, and orders. A key outcome of this effort is the introduction of "Flags," a feature designed as a catch-all indicator for any significant events affecting an order throughout its lifecycle. While "Flags" is detailed in a previous chapter, it also plays a crucial role across data tables, alerting users to any flagged orders, specimens, samples, or shipments that require attention due to alerts or discrepancies before they can proceed in the processing pipeline.
We discovered the following needs for an improved treatment of Specimens and Shipments:The users of the New LIMs Ecosystem at Adaptive require a unified approach to manage specimen samples and shipments across multiple software systems.
Within the order management software, it would be critical for Clinical Services to receive timely updates once specimens complete the intake process and are ready for the resolution of any flags that may arise during the shipment receiving or intake phases.
Users would require a centralized interface for updates and data, rather than being forced to navigate multiple siloed sources like Salesforce and Tableau. This fragmentation complicated workflows and hampers efficiency, highlighting the need for a more consolidated, integrated approach to data management and notification within the ecosystem.
-
The new Order Management System (OMS), used by various customer-facing teams was lacking the contextual tools necessary for understanding:
order statuses,
issues and
assignments.
Additionally, leadership faced challenges in gaining deep insights into critical metrics like:
Revenues,
sales, and
incoming orders.
Please read on to discover our recommendations for the findings we’ve described in this last section.
User Research
We adopted the following approach:
SME Audit Team led by UX: A small group of subject matter experts (SMEs) was elected as our go-to UX research representative.
Weekly Dev/SME Meetings led by UX: We held ongoing one-on-one SME interviews, brainstormed pain points, and collaborated on new feature ideation.
Weekly SME Meetings led by UX: We hosted weekly group SME meetings, during which we presented low—and high-fidelity rapid prototypes, collected feedback, and directed further iteration on new designs.
Business value achievements resulting from research methods
We achieved additional “wins” by our research methods:
Trust building with leadership: The regular SME group discussions in a cohort of 15-25 SMEs across the business provided well-rounded representation and ultimately repaired trust between the business partners and the software team.
Limited Decision makers: We also had a few developers and data architects present in these meetings, which further served to break down silos.
Rapid Person Identification: We identified as a team of over 24 personas and crafted rapid proto-personas via team call interview sessions. (Below)

Hundreds of hours of audits produced inefficiently antiquated workflows and outdated SOPs in how users solved problems with the old order-management tool. This took eight years to build.

My team then captured hundreds of workflows across three software platforms in the Lucid chart. These flows and existing screens go through an SOP Audit for new documentation and division approval.

Many types of Qualitative tools were used to understand how to better support our scientists and internal staff along the Order Ecosystem.
Advanced tools, like scenario mapping, were deployed to understand sophisticated laboratory workflows, which had profound systemic impacts
on employee retention and efficiencies.


Smaller digestible segments of the broader journey map were developed into Miro as a "working organic mapping experience" for leadership SME's and stakeholders.

Leadership-level journey mapping specific to niche areas within the ecosystem was also developed on a case-by-case basis. These became talking points for subject matter experts, SOP discussions, budget discussions, and investment Analysis.

Laboratory sample accessioning journey map

In an effort to uncover laboratory employee persona happiness and efficiency within a multitude of different workflows, a detailed investigation involving interviews and timing analysis of workflows uncovered interesting results for the UX team.
Leadership Pitch.
The leadership pitch focused on UX anatomy.
As a leader of the new product initiative for the MLE LIMS ecosystem, I, the systems architect and head of engineering, prepared a presentation for leadership. Some of the slides to the right represented our approach to adding deep business value to the users of the order management system and its connected systems.


