Live Cluster Browser
What does it look like when an algorithm finds the counterfeit ring hiding behind dozens of storefronts?
The third step after From Marker to Pixels: the same network intelligence graph, from a marker sketch, to a Figma mockup, to something you can run.
- Run the algorithm, or press Step to walk through it one rule at a time.
- Run the algorithm, or press Step to walk through it one rule at a time.
- Press Run the algorithm to watch it find the ring, one rule at a time.
- IP address
- Phone
- Home site
- Storefront
- Seller account
- Street address
- Social profile
- Flagged by the algorithm
- Flagged link
- Press Run the algorithm to watch it find the ring, one rule at a time.
- IP address
- Phone
- Home site
- Storefront
- Seller account
- Street address
- Social profile
- Flagged by the algorithm
All data is fictional. IP addresses, phone numbers and domains use ranges reserved for documentation and testing.
From marker to live code
The graph started on a paper pad at OpSec Security, became a Figma Cluster Browser, and years later became the live experience above. Hand-drawn, persona-driven sketches won leadership buy-in for the network intelligence MVP before a single screen was designed. The live rebuild was refined in versions, each one critiqued and kept so the progression stays visible.
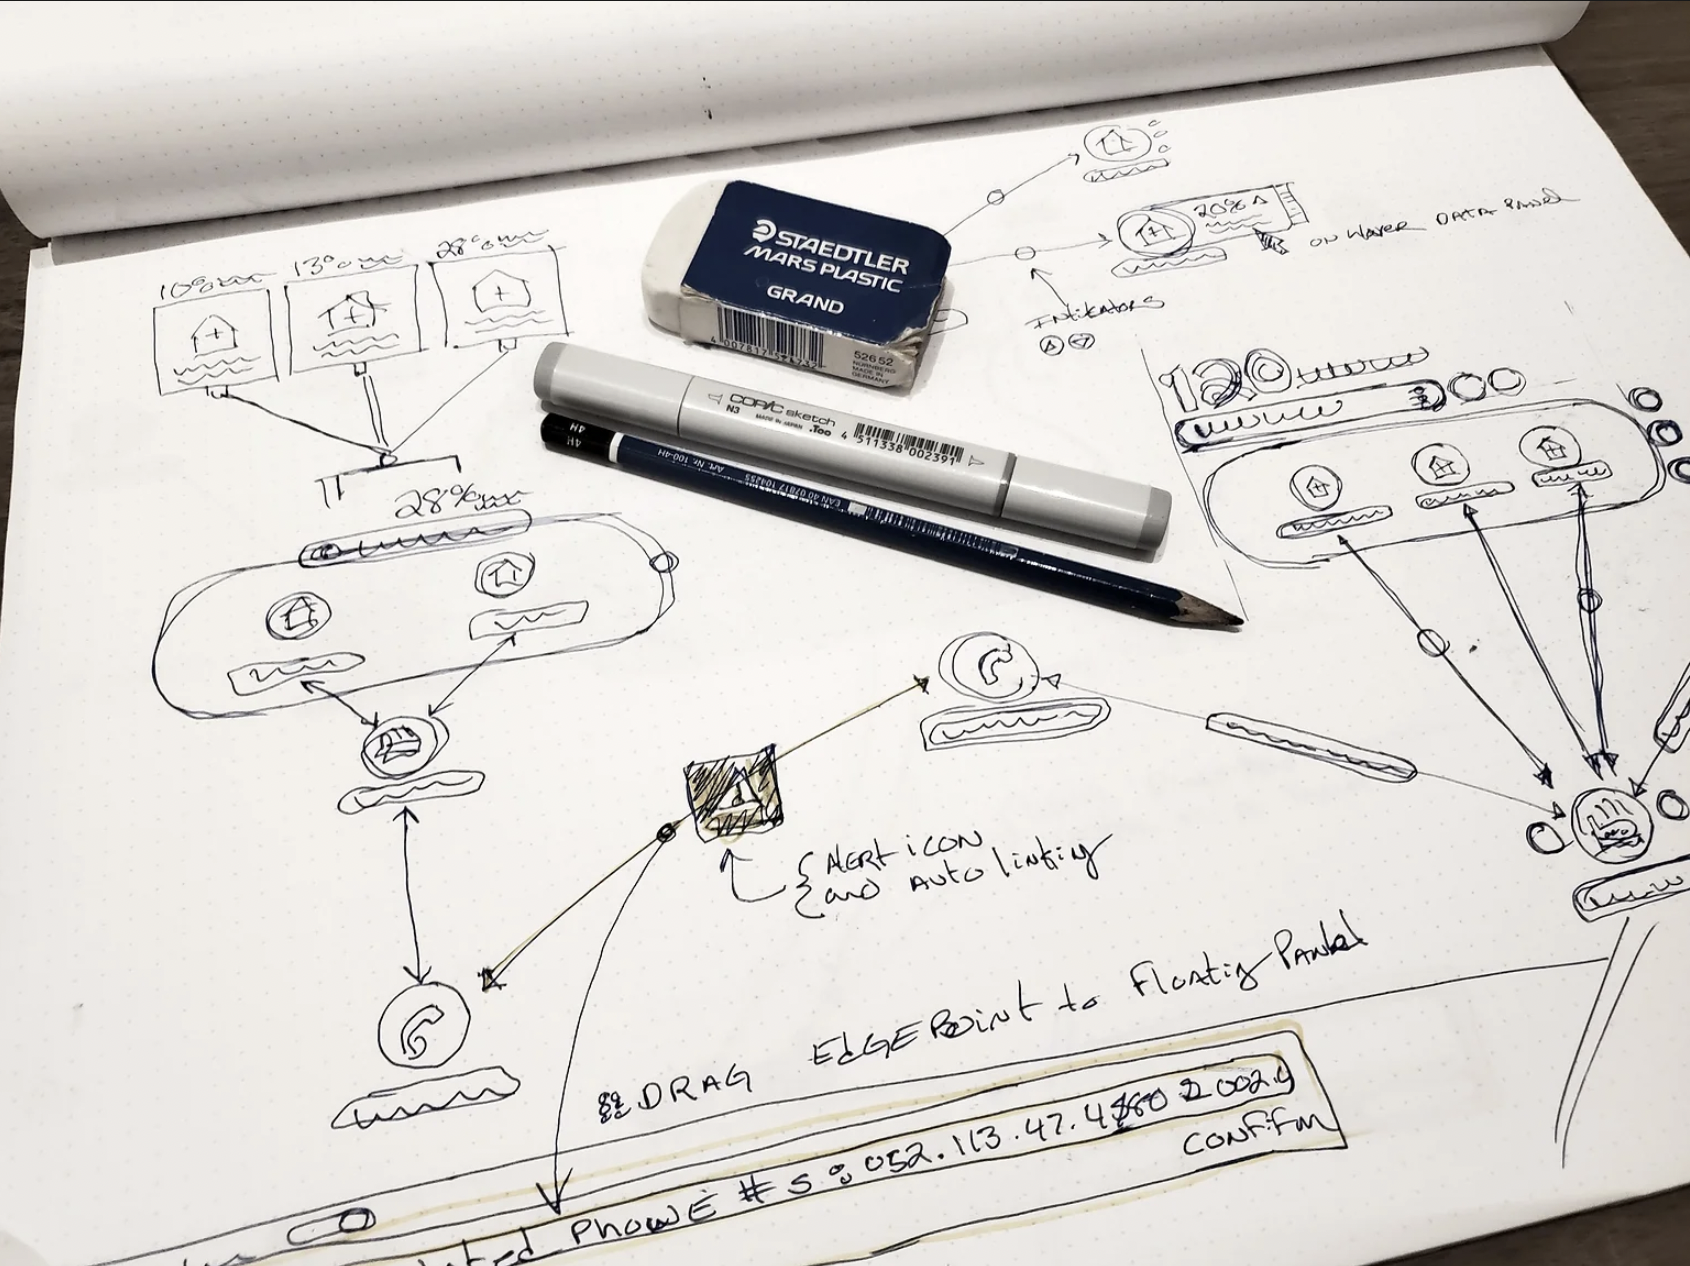
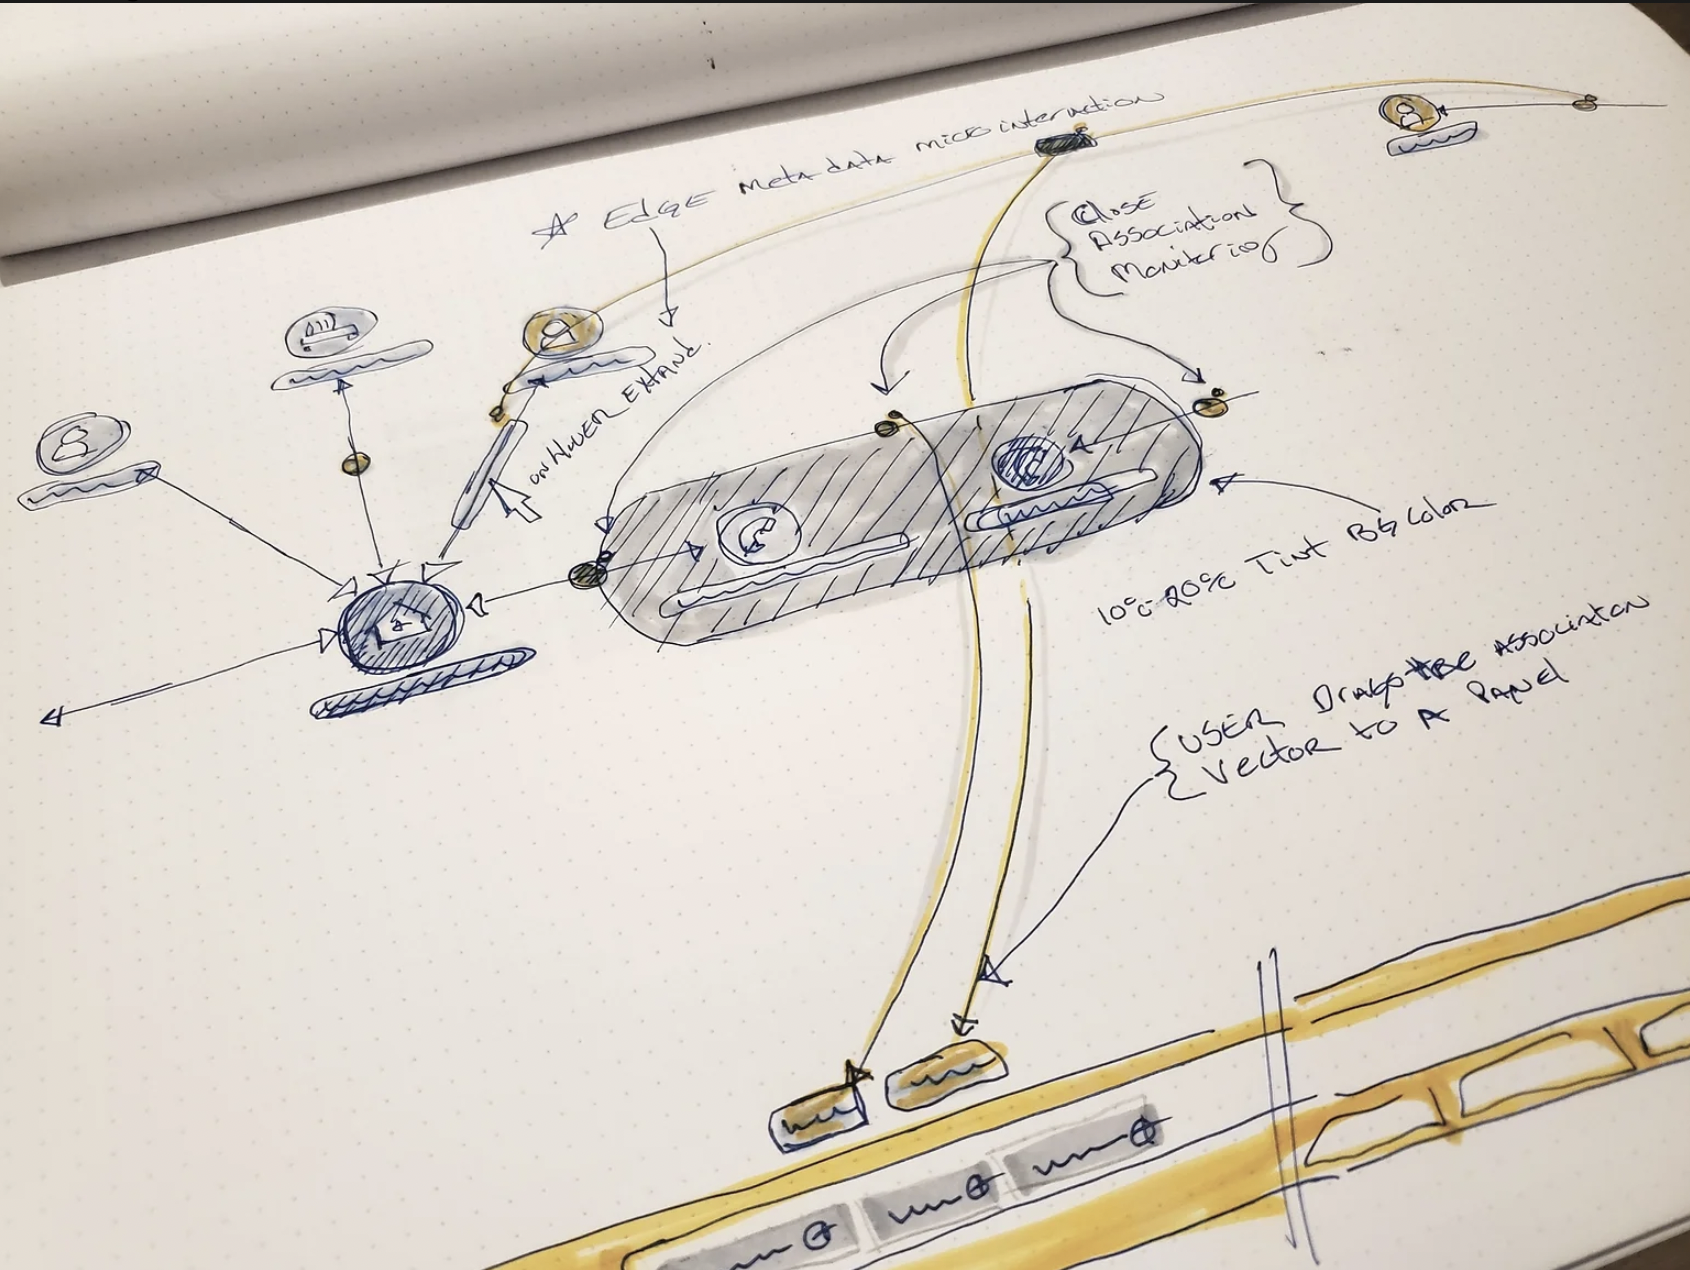
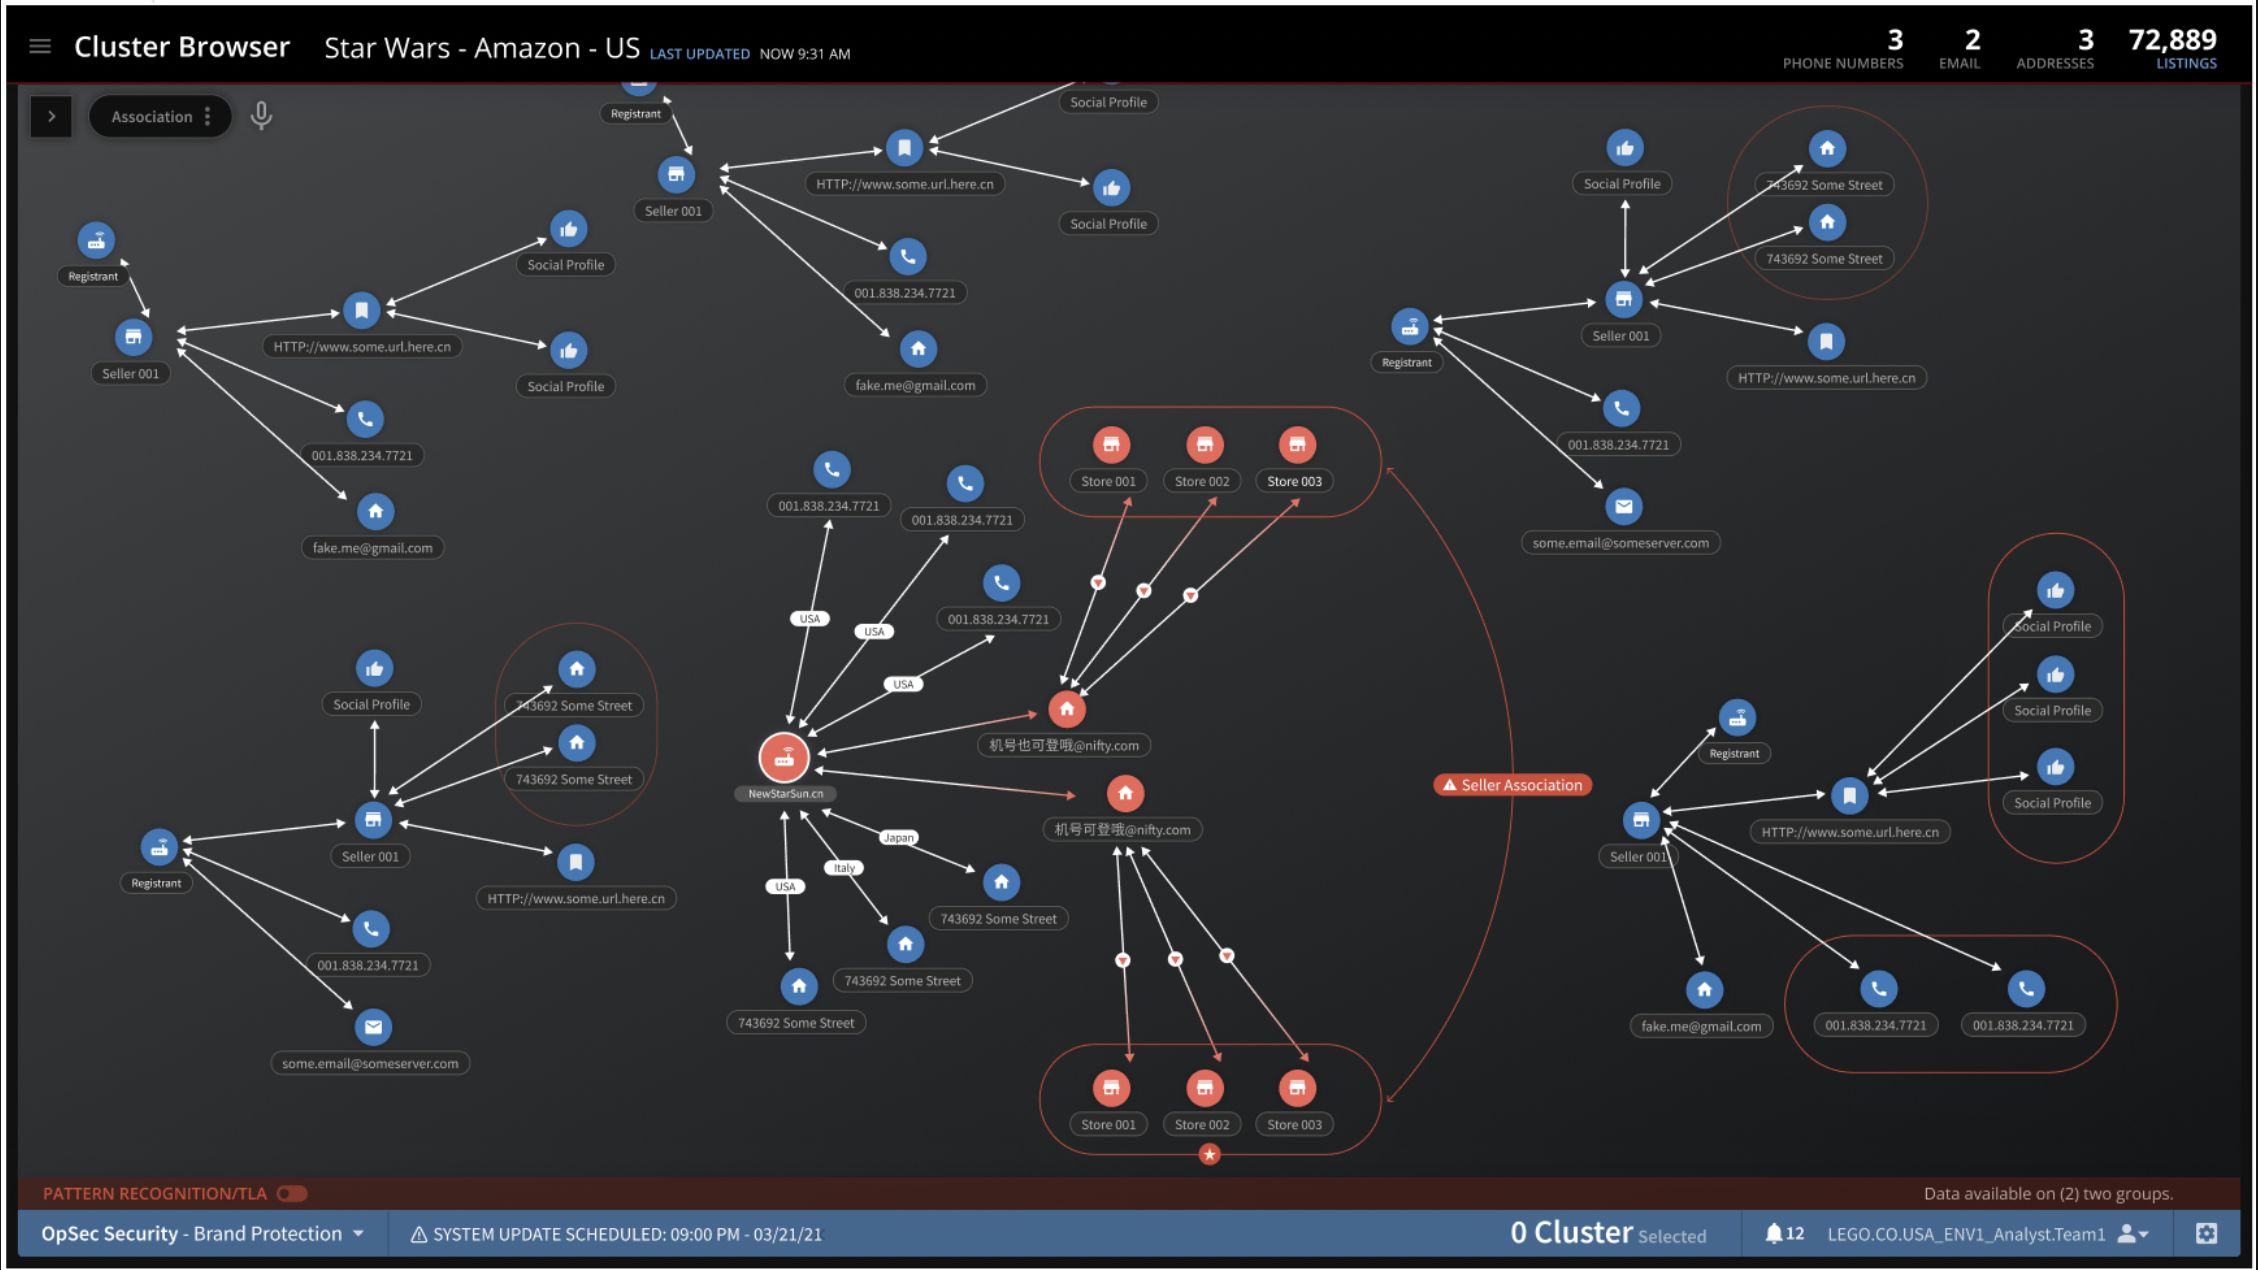
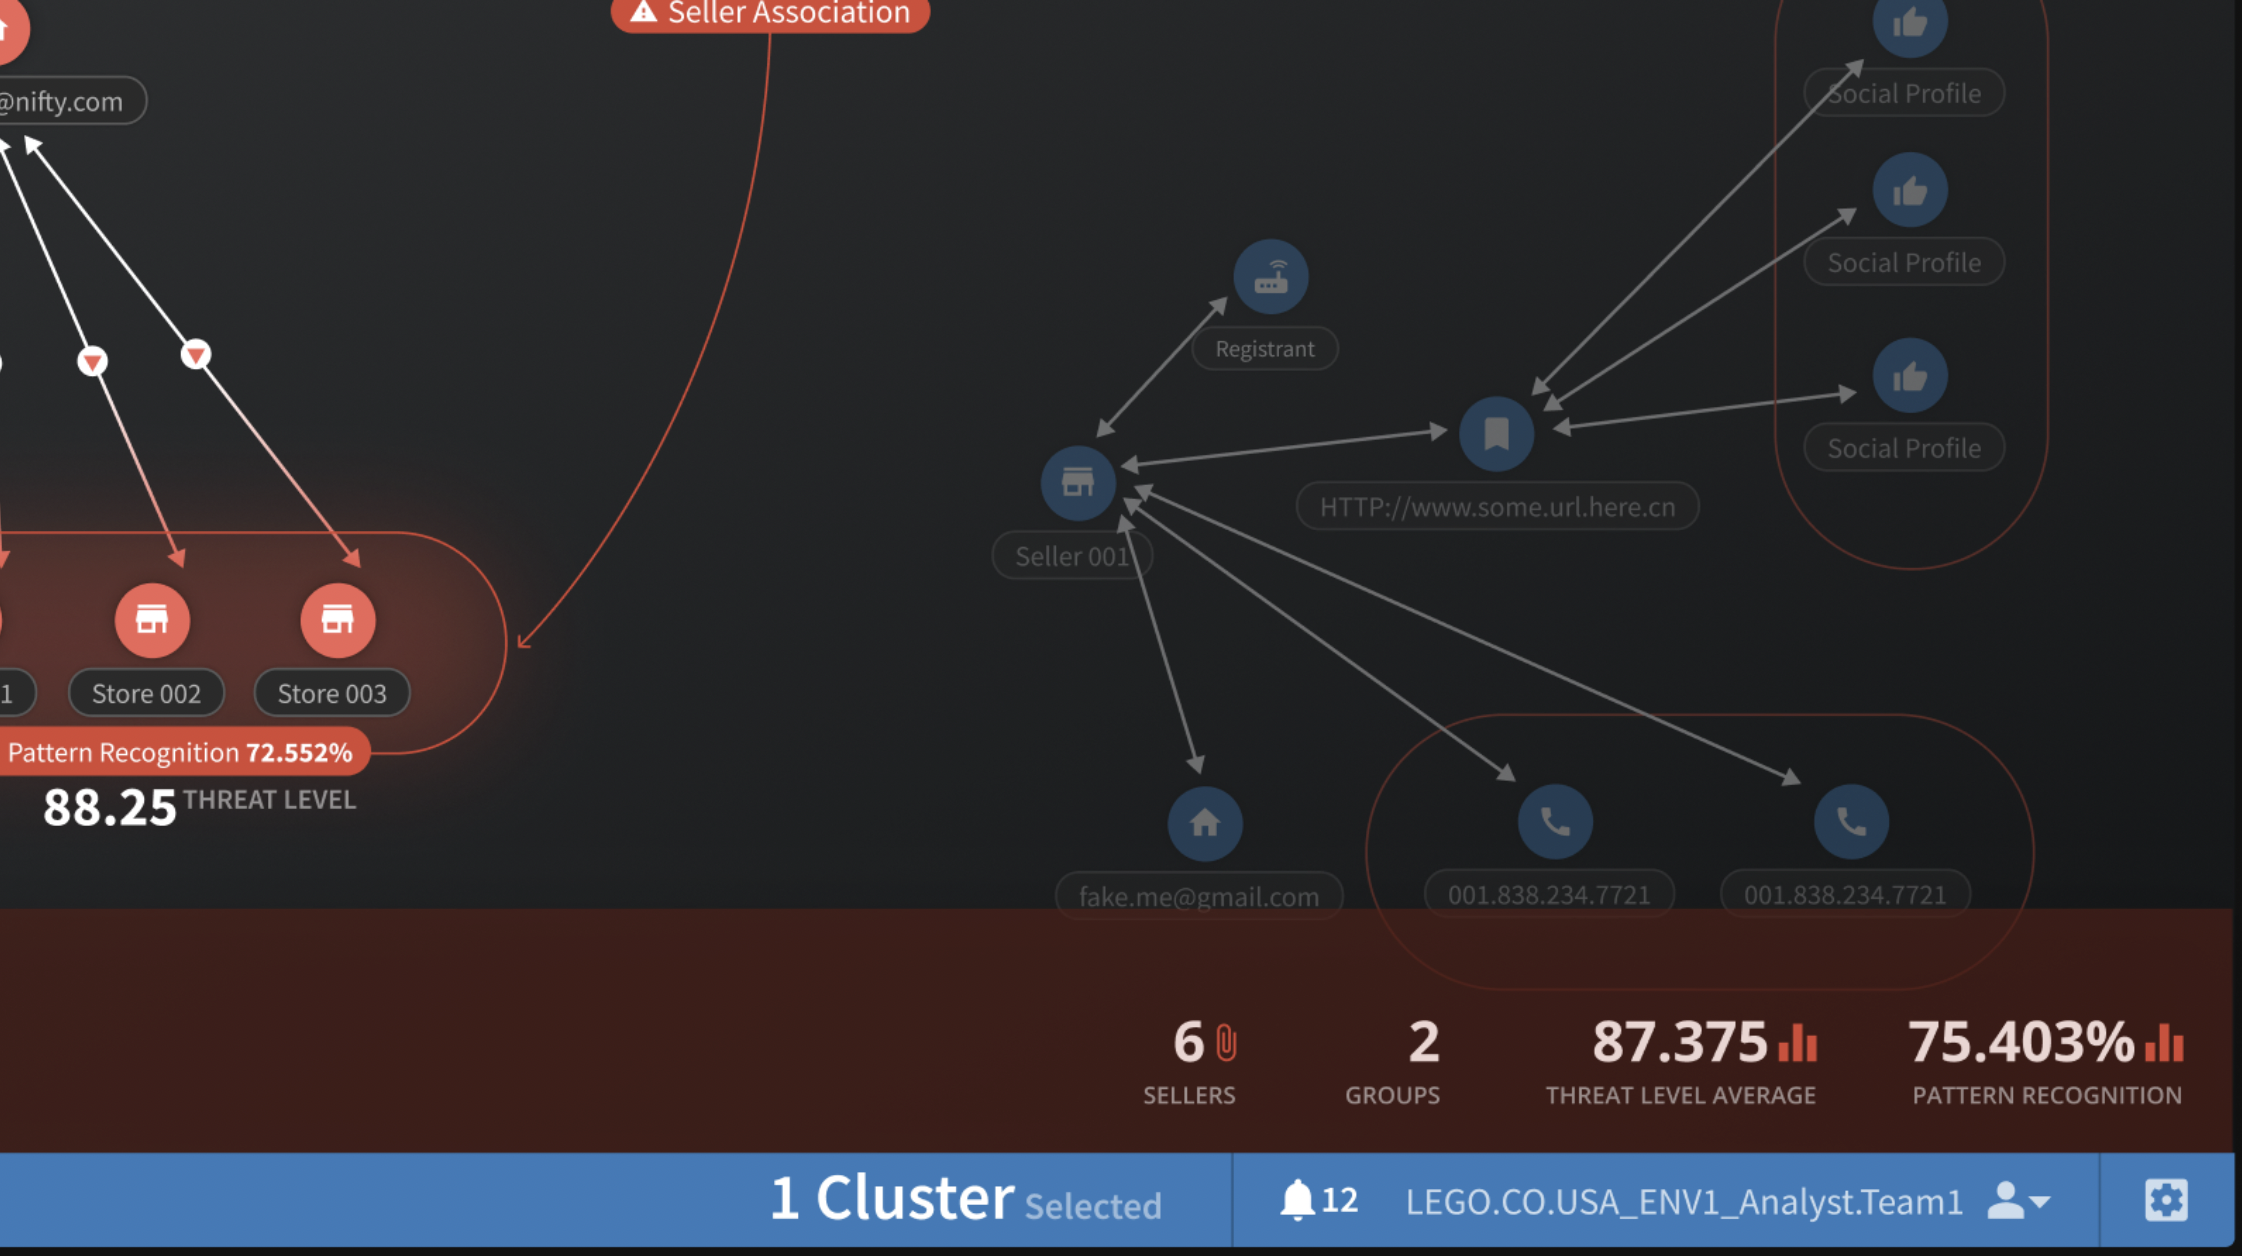
Version 1.4: refining the score
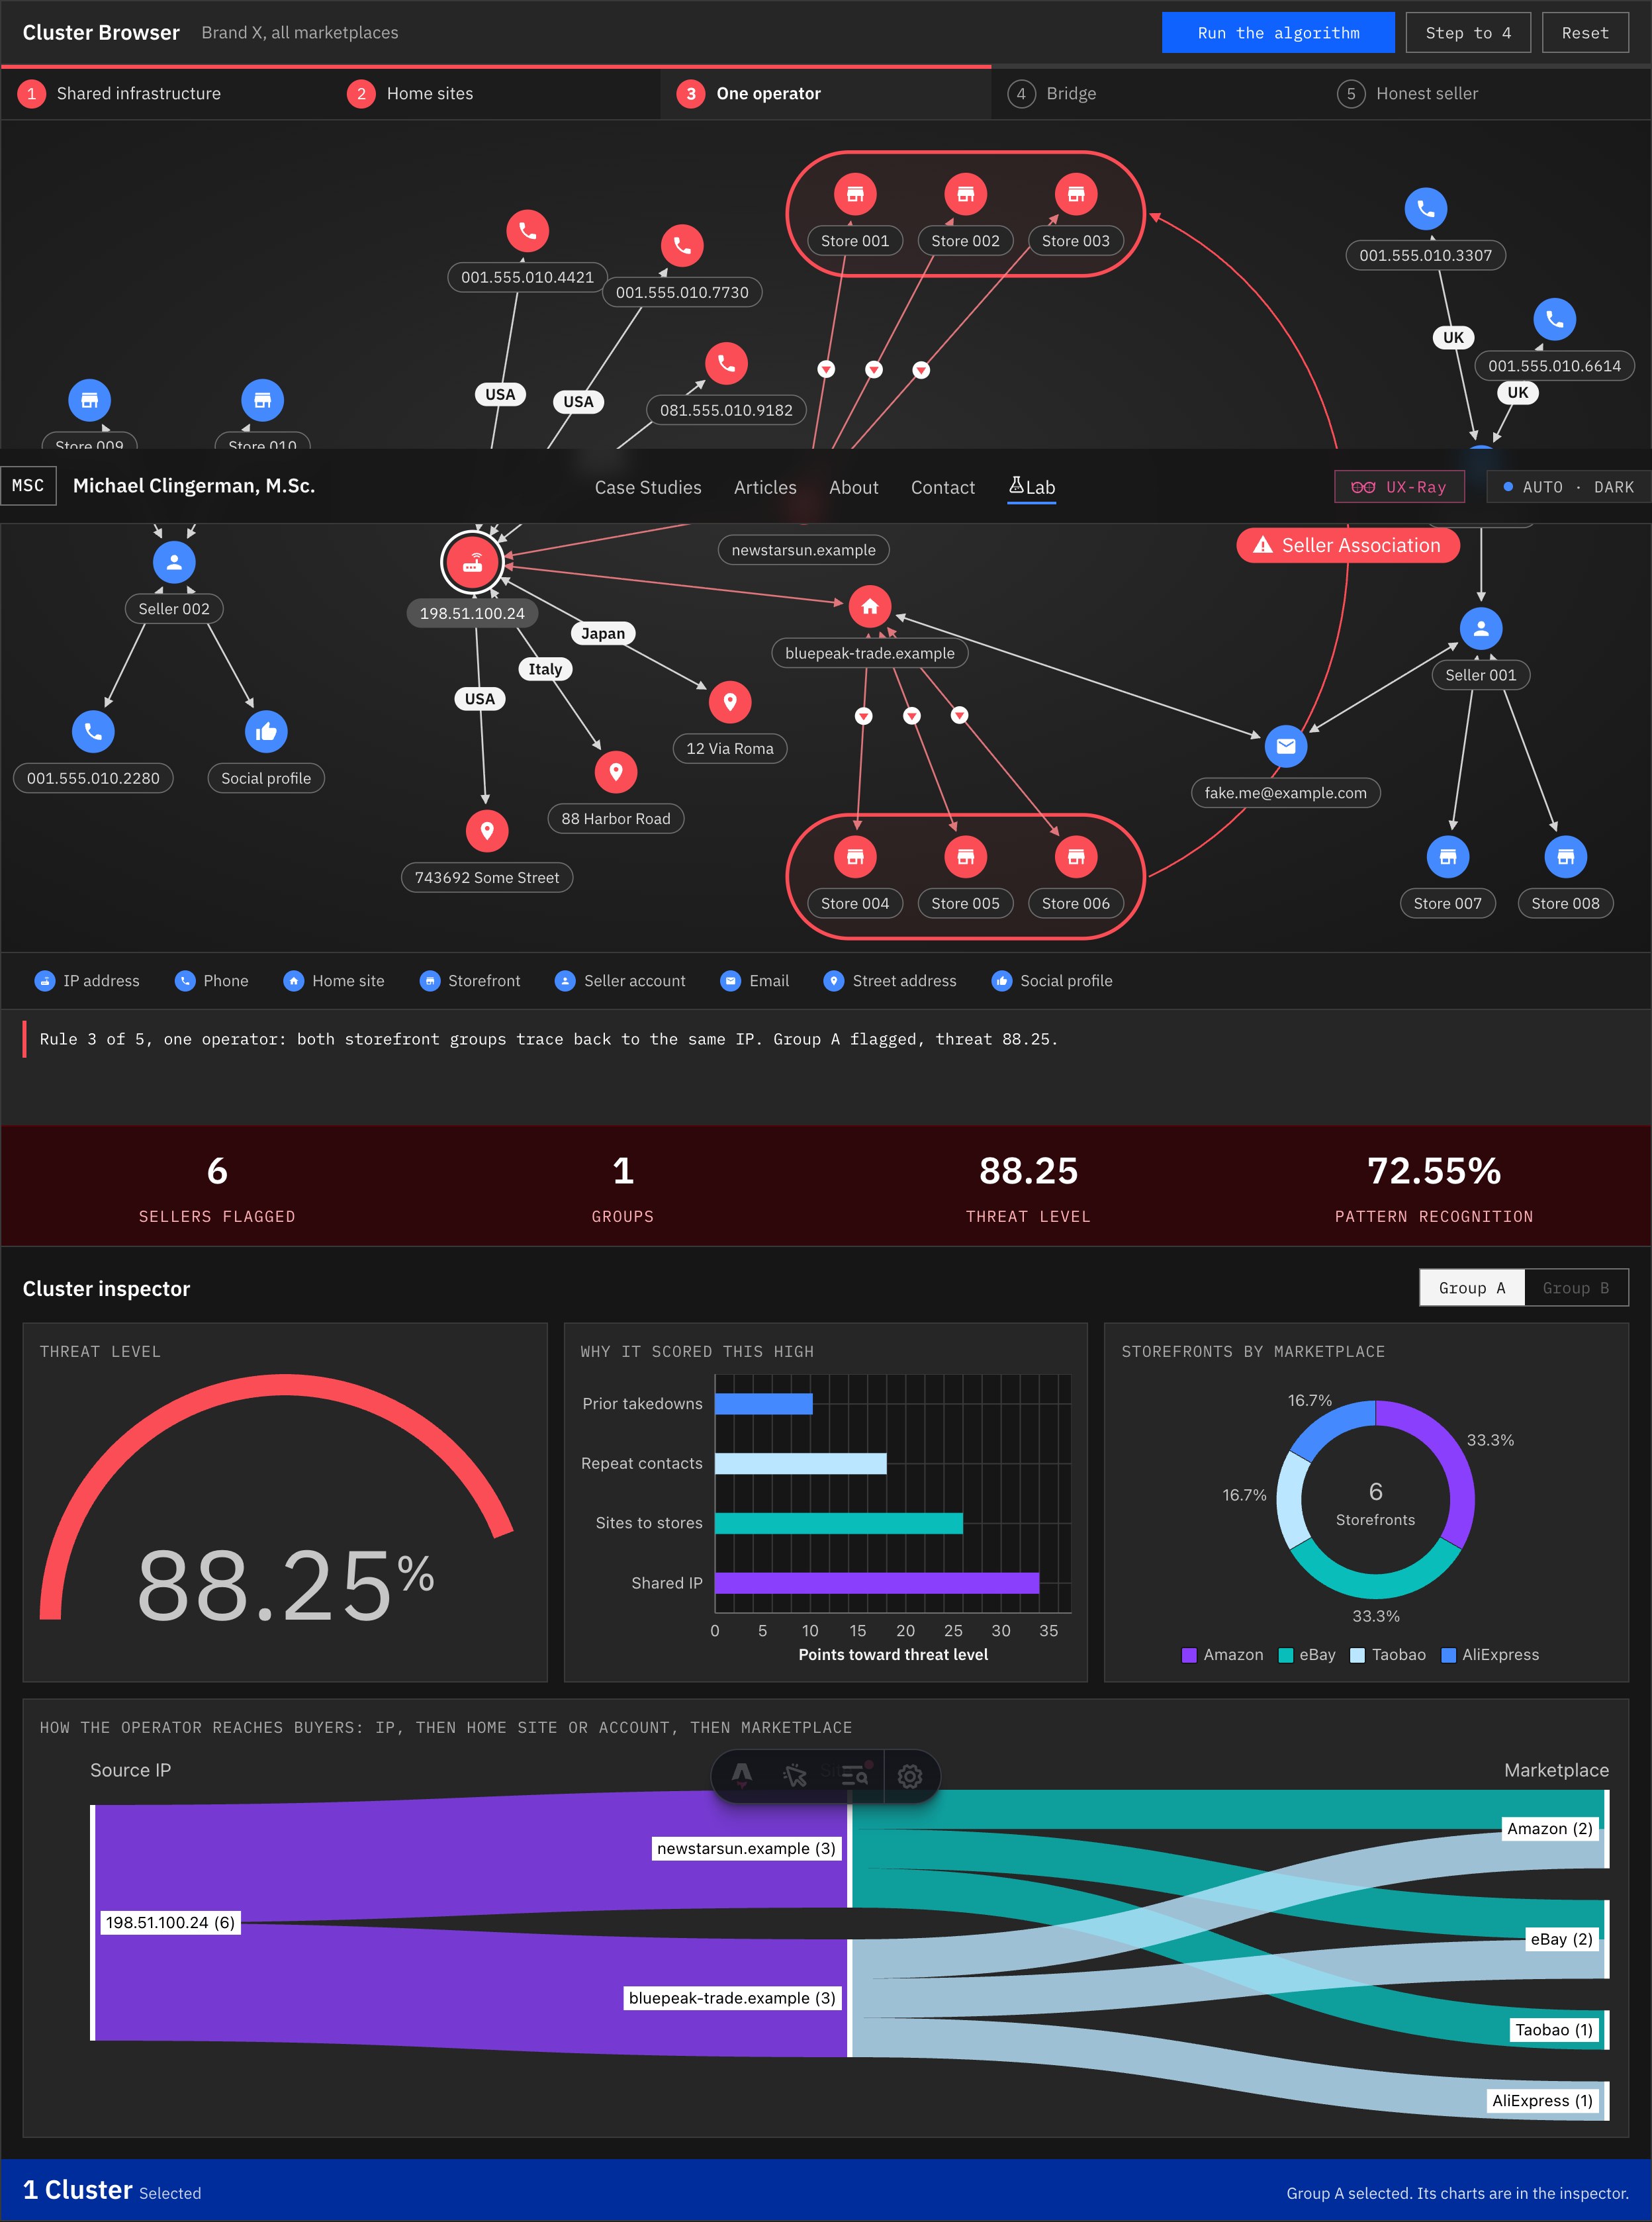
Version 1.4 goes back to the threat panel from the Figma frames and refines the scoring itself, with IBM Carbon icons throughout.
- Score badges on the canvas. Each flagged group carries its own badge, as in the mockup: a pattern recognition pill, a large threat level, a severity tag and a ten-segment meter.
- Severity in Carbon status colors. Critical from 80, high from 60, medium from 40, so a score reads at a glance before you read the number.
- A threat strip with a visual per metric. Sellers as a row of people, groups as lettered chips, threat level as a meter and pattern recognition as a bar, all in tabular numbers.
- Selection focus. Selecting a group fills its capsules with a soft red glow and steps everything else back, the way the Figma frame dims unselected clusters.
- Carbon icons. Router, phone, home, store, email, location, user and thumbs-up for the entities, plus security, meter, chart and notification icons in the panels.
Version 1.3: step through it
Version 1.3 keeps the 1.2 composition and makes the explanation interactive. The goal is the same open-box idea as the shipped product: an analyst should be able to see each rule fire, go back to any rule, and understand why a group was flagged.
- Step through the rules. Run it, pause it, or step one rule at a time. Every rule in the progress rail is a button, so you can jump back to rule 2 and see its evidence again.
- The legend is a filter. Hover a type to preview it, click to keep only that type in focus, following Carbon's legend behavior.
- Links explain themselves. Hover or tap any link for the relationship, the country and when it was first seen, from the sketch note about edge metadata on hover.
Version 1.2: closer to the Figma
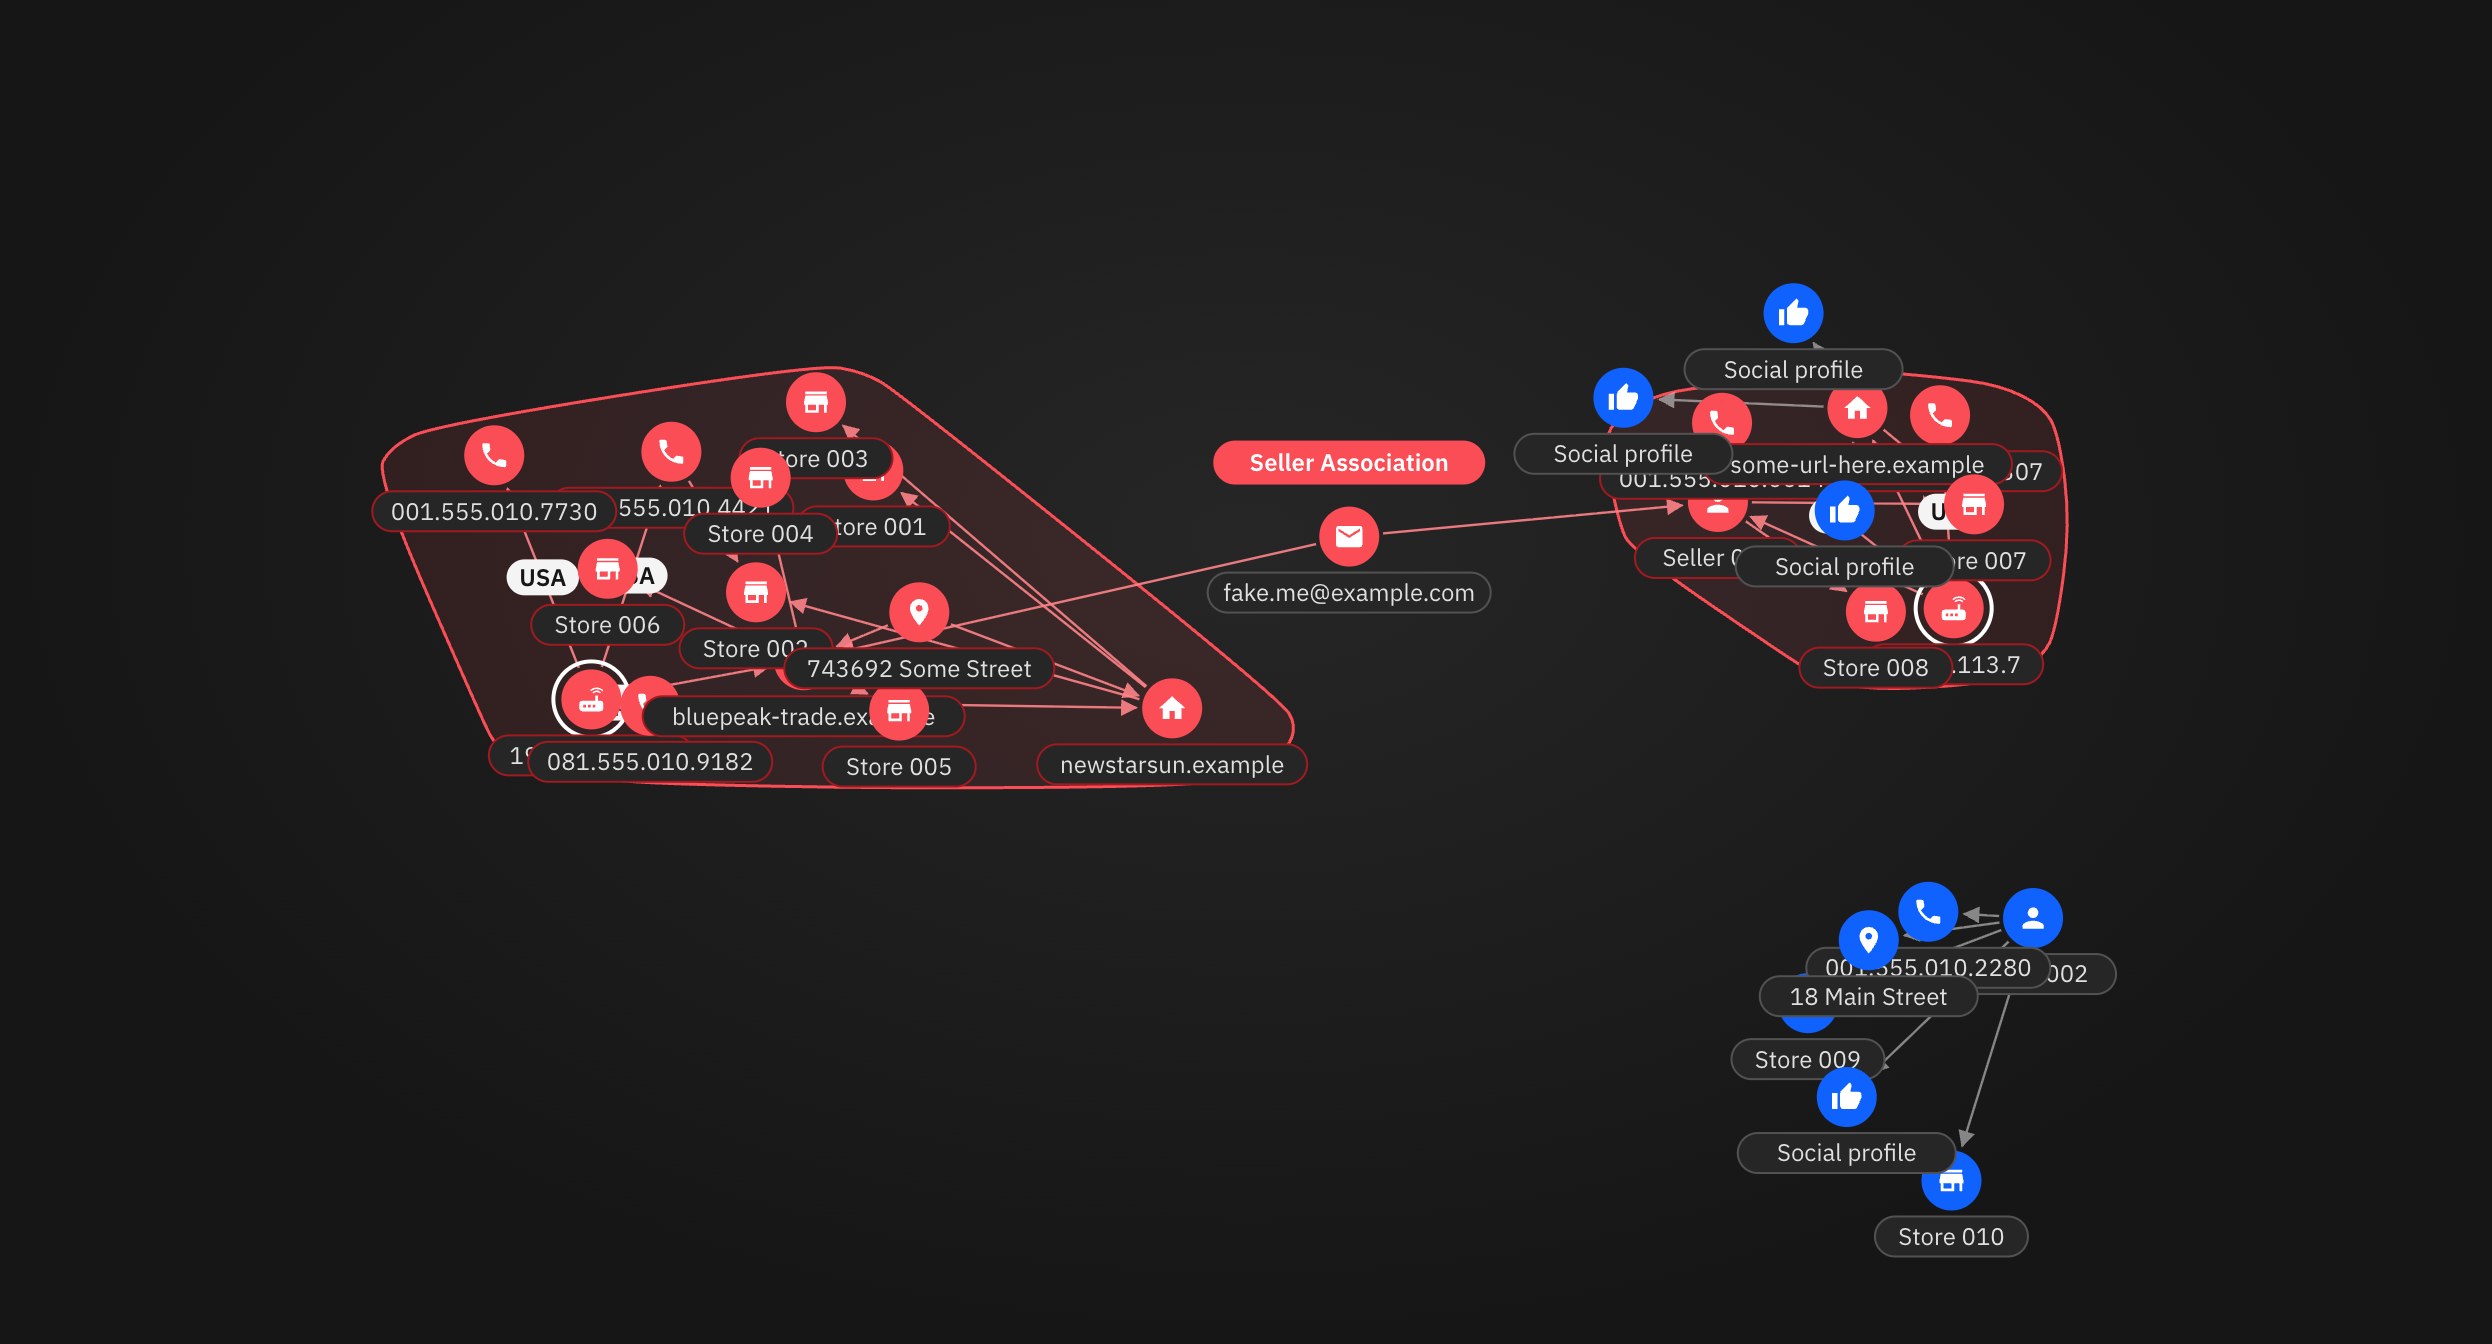
Version 1.0 proved the idea, but its physics layout let nodes pile up and labels collide. Version 1.2 goes back to the original Figma frame and composes the graph by hand, the way an analyst would want to read it.
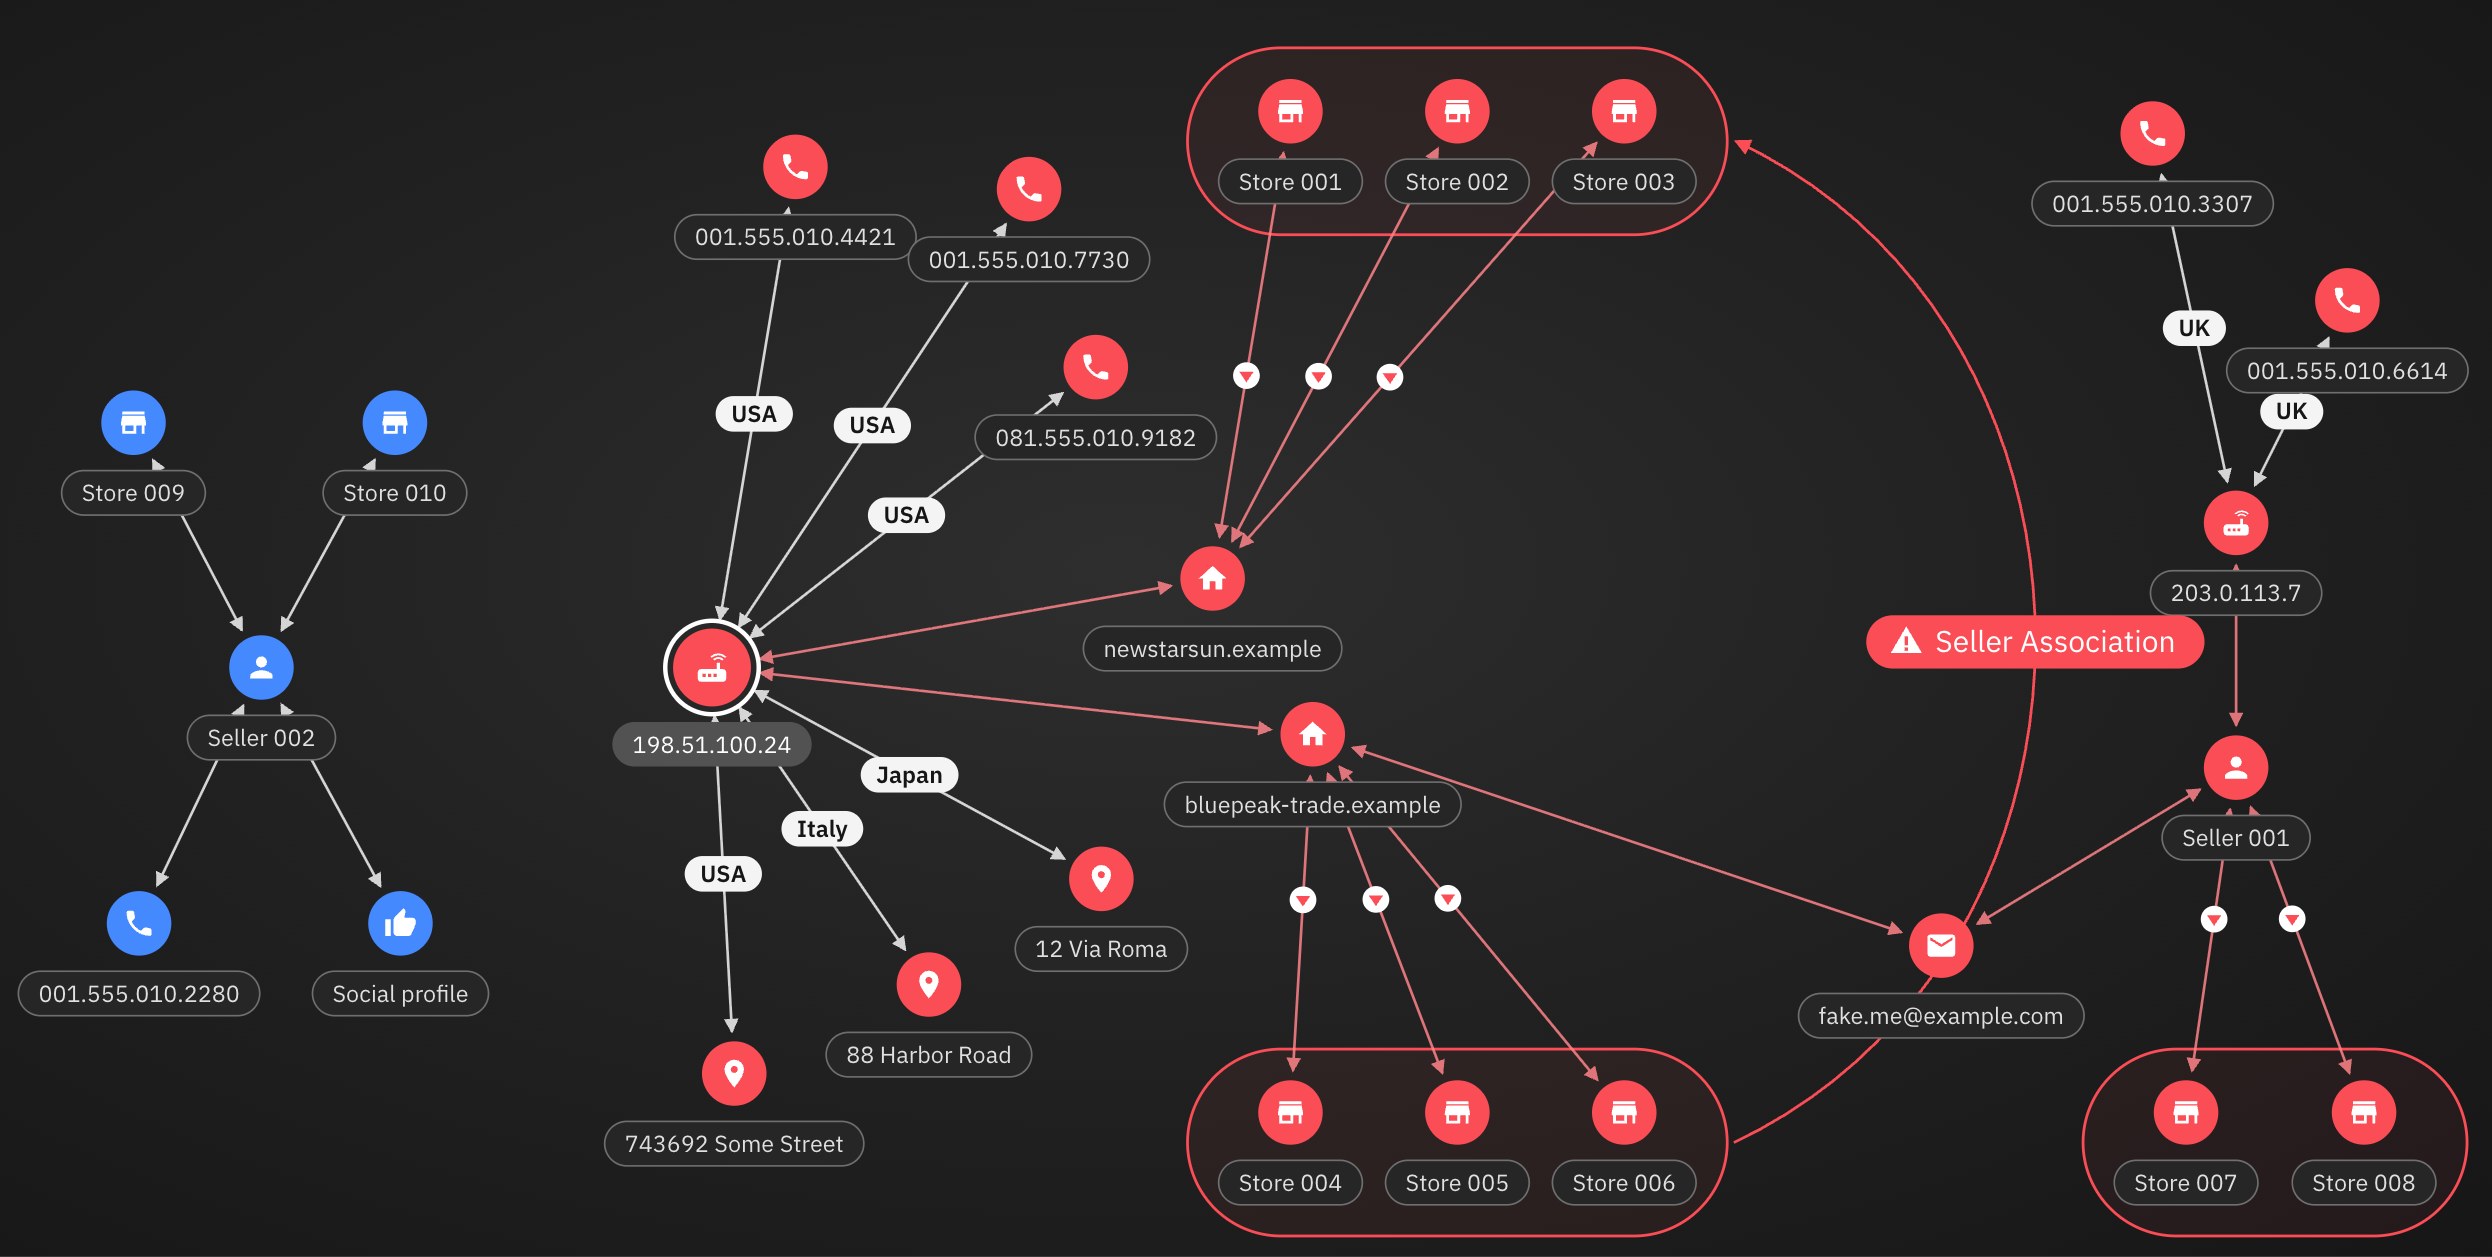
- The IP is the hub. Phones and street addresses radiate from it, with country chips on the links, as in the mockup.
- Storefronts sit in rows. Each home site's storefronts line up inside a capsule, and flagged links carry a small red marker.
- The Seller Association arc is back. The long curve from the mockup now draws in when the algorithm proves both storefront groups belong to one operator.
- Two-way arrows and calmer spacing. Larger nodes and labels on an even grid, and no more overlapping text.
- Still interactive. Drag any node, zoom and pan, and run the same detection rules as version 1.0.
Technology stack
Everything runs in the browser. There is no charting library and no server behind the demo.
- Visualization
- Hand-written inline SVG: nodes, two-way arrows, country chips, flag markers, group capsules and the Seller Association arc. Labels are measured with the real font so every pill fits its text.
- Layout
- Versions 1.2 to 1.4: a composed canvas based on the Figma frame. Version 1.0: a custom force-directed simulation (springs, repulsion and cluster anchors) running on requestAnimationFrame.
- Interaction
- Pointer Events for mouse, pen and touch dragging, with pointer capture. Zoom and pan move the SVG viewBox, plus trackpad pinch. Hover and tap detail panels, keyboard focus on every node, and ARIA tabs for the versions.
- Geometry
- Cubic Bezier math for the association arc and its tag, padded bounding capsules in 1.2, and convex hulls (monotone chain) for the group outlines in 1.0.
- Motion
- CSS transitions and keyframes, stroke-dashoffset line drawing, and an IntersectionObserver that draws the graph in when it scrolls into view. All motion respects prefers-reduced-motion.
- Detection logic
- A scripted, rule-by-rule run over the graph data: shared infrastructure, home sites to storefronts, one operator, then the bridge to a second seller. Each rule writes a plain-language line to the log.
- Design system
- IBM Carbon tokens (Gray 100 theme, Blue 60 primary action, Red 50 status color, Carbon status colors for severity), IBM Plex Sans and Mono, and IBM Carbon icons in version 1.4 (Material Design icons in earlier versions).
- Framework and code
- TypeScript in Astro 5 components, bundled by Vite and served as a static page.
- Data
- A fictional network kept in the page. IP addresses, phone numbers and domains come from ranges reserved for documentation and testing.
- Build and hosting
- Designed in Figma, built with Claude Code, versioned on GitHub and deployed to Cloudflare by GitHub Actions.
- The original product
- At OpSec, the real system ran on graph databases (Neo4j, with ArangoDB evaluated in discovery) and a third-party graph visualizer. This demo recreates the experience, not that backend.
What the algorithm is looking for
At OpSec Security, analysts protected brands from counterfeit sellers on Amazon, eBay, Taobao and other marketplaces. Taking down one storefront rarely mattered: the same operator would open another the next day. The real target was the operator behind the storefronts.
We loaded years of enforcement history into a graph database (Neo4j, with ArangoDB in discovery) and looked for shared infrastructure. One IP address controlling several phone numbers and home sites, and those home sites listing a cluster of storefronts, is a pattern no honest seller makes. The graph surfaces it in seconds. A spreadsheet hides it across thousands of rows.
Design decisions carried into the demo
- Start from the pattern, not the table. The algorithm groups and colors the ring, so analysts begin with the answer and drill into the evidence.
- Every flag explains itself. The step log names the rule that fired and the entities it used, the same open-box principle as Open-box AI Tagging.
- A 10% tint, not a wall of red. Groups get a low-opacity capsule so the nodes inside stay readable, straight from the margin note in the sketch.
- Details on hover. A dense graph stays calm until you point at a node.
- Not everything is guilty. Seller 002 shares no infrastructure, so it stays blue. A tool that flags everyone gets ignored.
How it works
Both versions are plain SVG with no charting library. Version 1.0 uses a small force-directed simulation: links act as springs and nodes push each other apart. Version 1.2 places every node on a composed canvas instead, then recomputes links, capsules and the association arc whenever you drag something. Zoom and pan move the SVG viewBox, so text stays sharp at any size.
Read the full project in OpSec: Rethinking Marketplace IT Security for Analysts, and the five-step process I design with in my design process case study.