From Marker to Pixels
How does a marker sketch on a paper pad become a shipped interface?
01Network intelligence graph
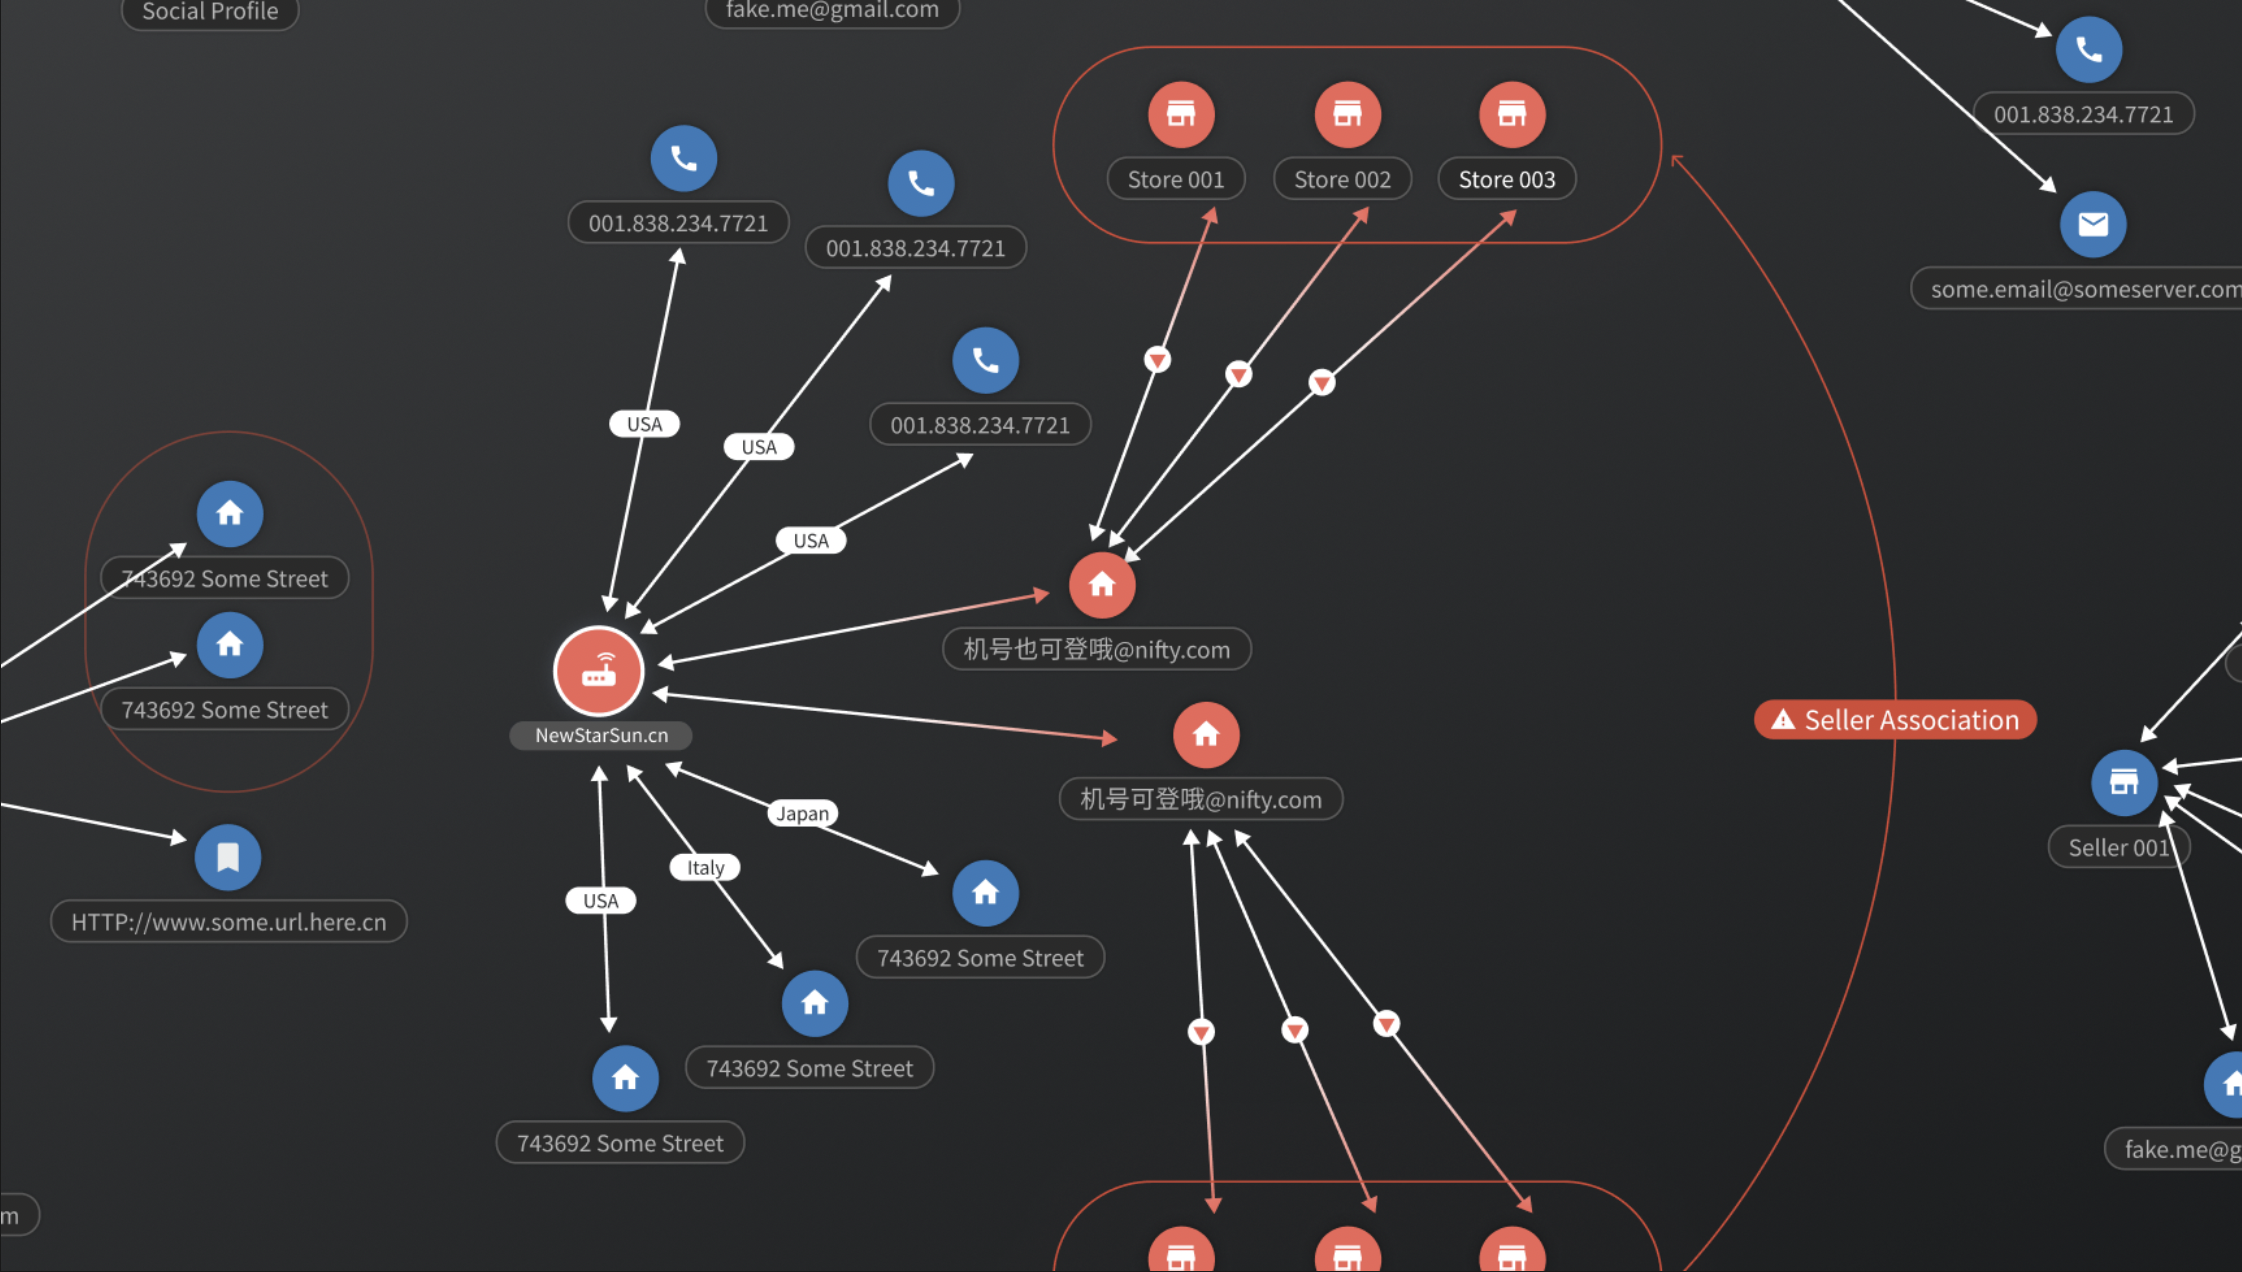
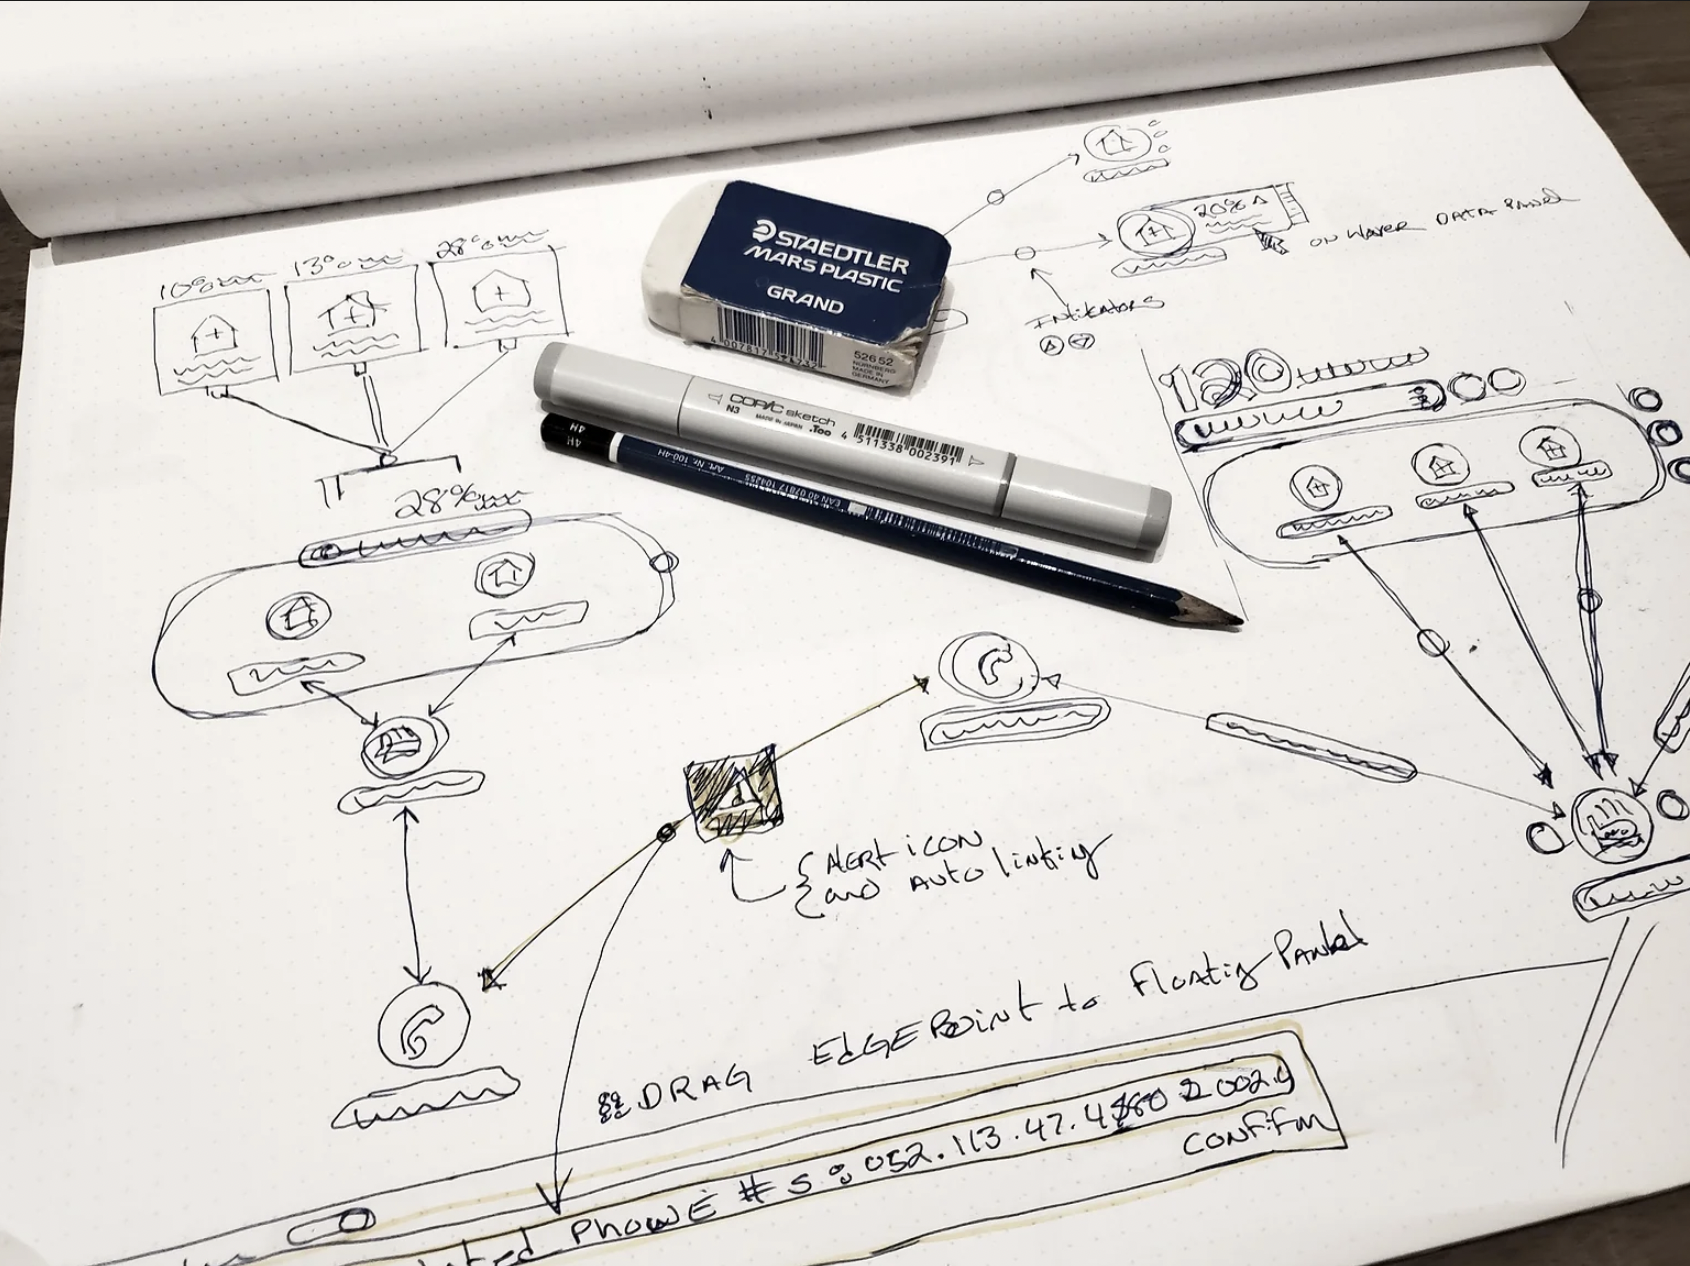
- "Alert icon and auto linking"
- Phones, addresses and storefronts connect to the seller under investigation automatically, so analysts start from the pattern, not a spreadsheet.
- "On hover data panel"
- Details stay out of the way until an analyst points at a node, which keeps a dense graph readable.
- "Drag edge point to floating panel"
- Connections became objects analysts can pull into focus, the root of the association workflow in the next sketch.
02Association monitoring
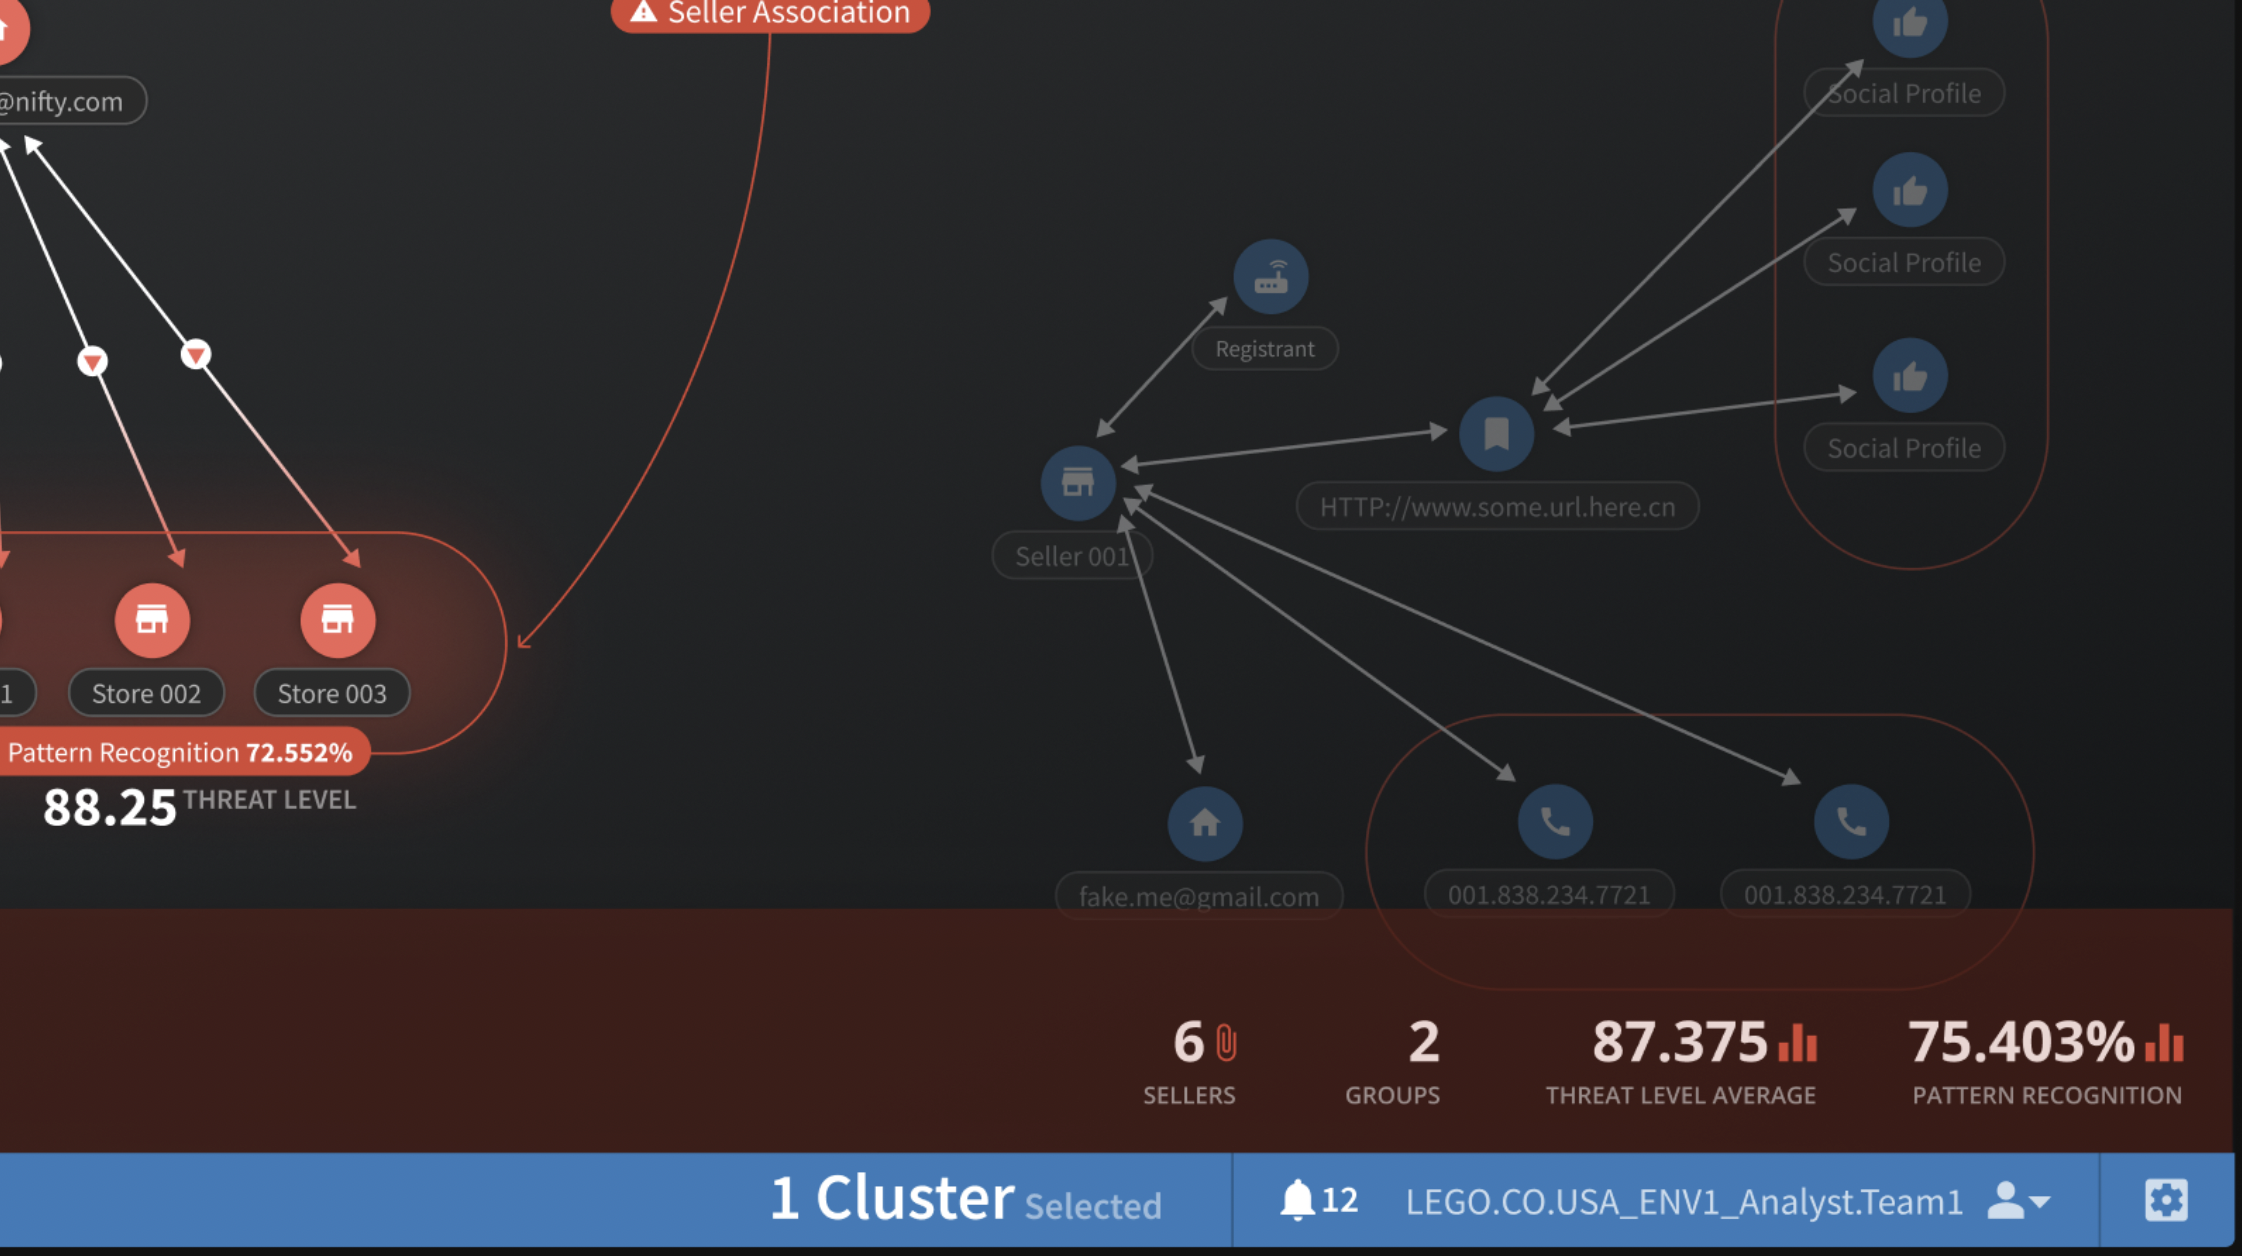
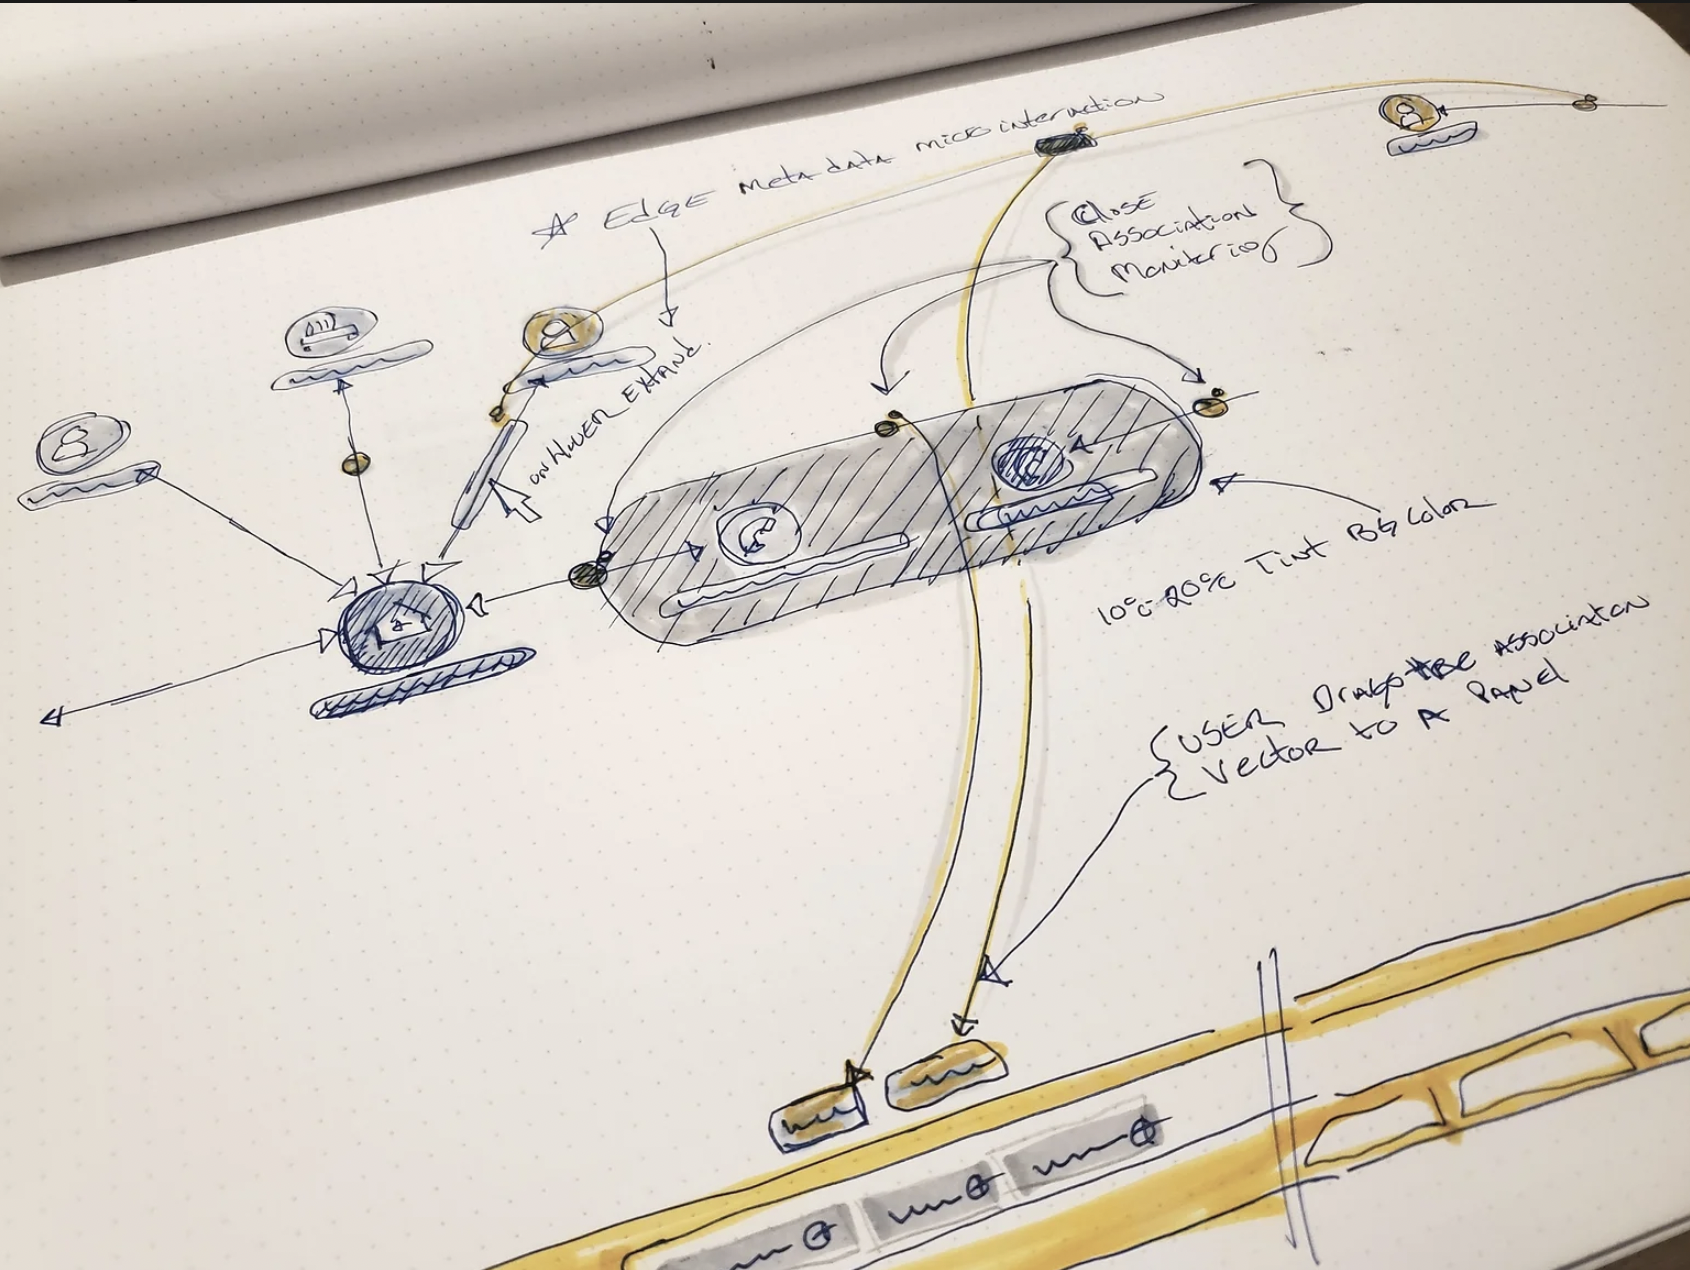
- "Close association monitoring"
- The tinted capsule became the red seller association group, so closely linked bad actors read as one threat.
- "10%-20% tint BG color"
- A low-opacity tint marks the group without hiding the nodes inside it, the same rule carried into the shipped colors.
- "User drags the association vector to a panel"
- Pulling an association into focus opens the threat panel along the bottom, with threat level and pattern recognition scores.
Why paper first
I start complex products on a paper pad with a marker. A sketch is fast, cheap and honest: it shows the structure of an idea before color and polish can hide its problems, and it invites people to argue with it. At OpSec Security, hand-drawn, persona-driven sketches like these won leadership buy-in for the network intelligence MVP before a single screen was designed.
Hand skills are becoming rare in design. I think they are a competitive advantage: the fastest way to think about a system is still to draw it.
Step three: make it live
The graph did not stop at pixels. In the Live Cluster Browser, you can run the detection algorithm on a fictional network, watch it group a counterfeit ring, and drag the nodes yourself.
Read the full story
These screens come from OpSec: Rethinking Marketplace IT Security for Analysts.